

U.S. Indices Technical Highlights:
- S&P 500 extended in record territory, a test of trend support may be near
- In the event the Nasdaq 100 pulls back soon we could learn just how strong it is
- Dow Jones continues to lag behind as value takes a backseat to growth
S&P 500, Dow Jones & Nasdaq 100 Technical Outlook for the Days Ahead
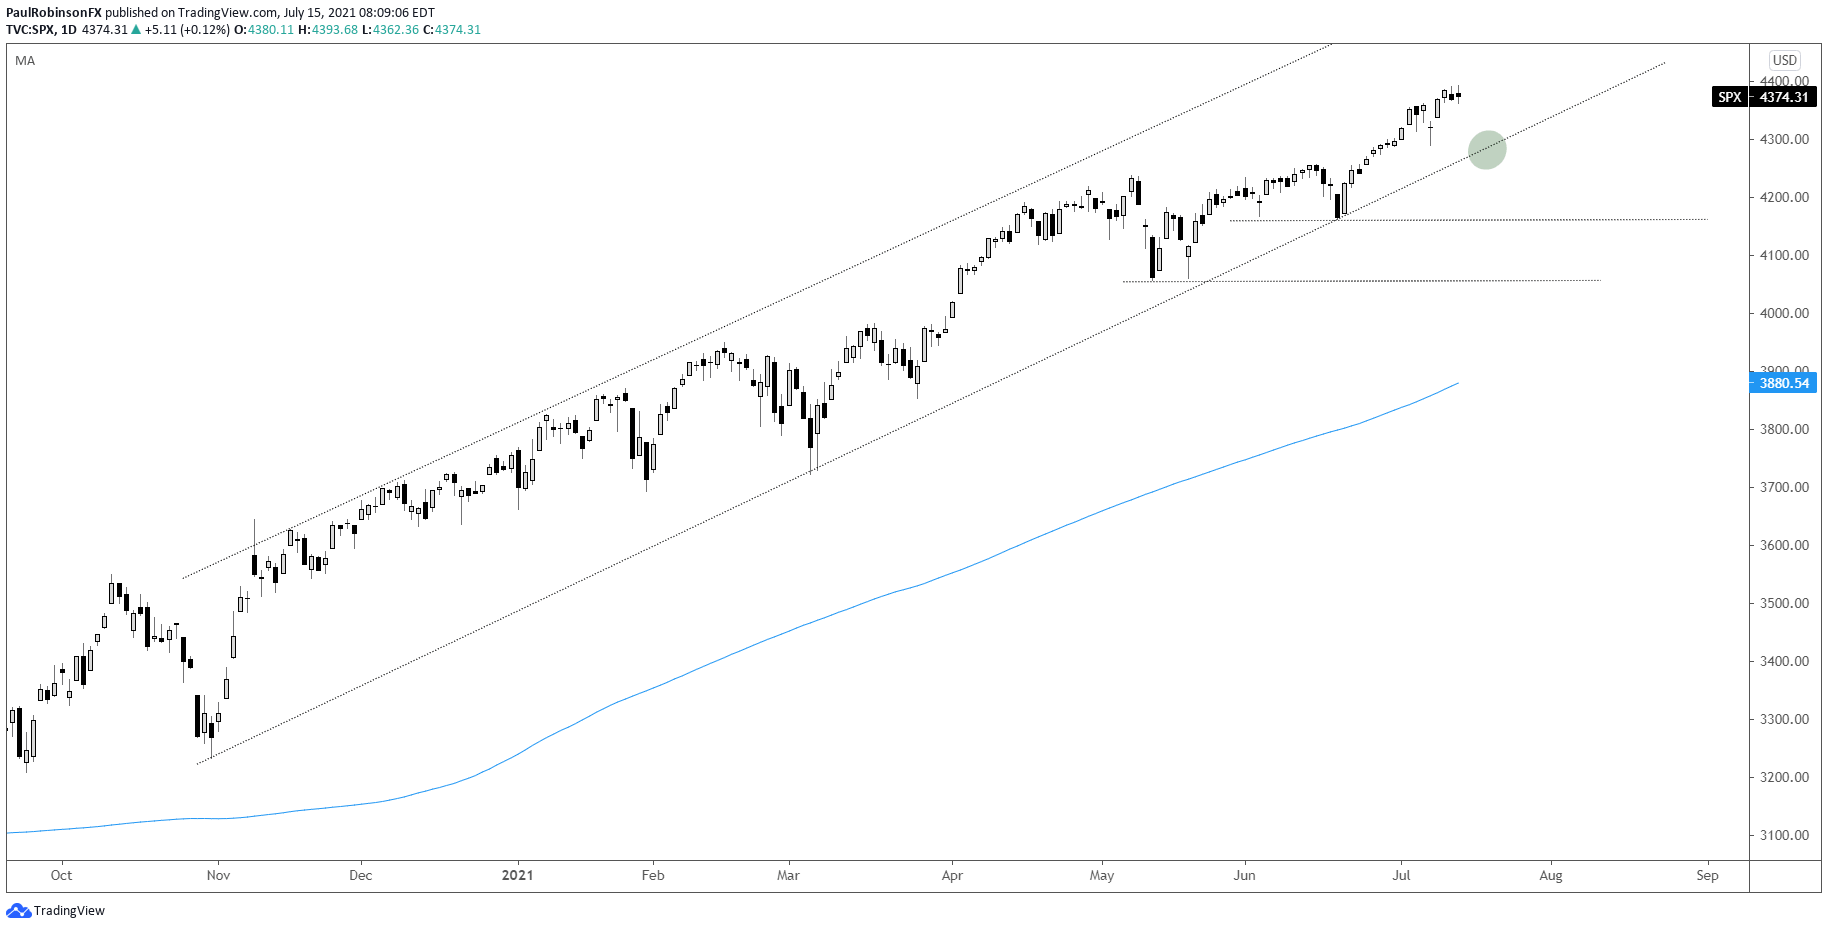
The S&P 500 continues to press on ahead into record territory with little in the way of setbacks. Just because the market is extended doesn’t mean it needs to pull back, but risk is certainly becoming elevated that at least a minor pullback is nearing.
A pullback from here may be short-lived, though, if the trend-line from October can hold as a meaningful upward line of support. A decline to the line and hold could make for a good spot for would-be longs to enter with a point of reference for assessing risk.
If the line were to break it doesn’t mean the trend has definitely turned, but it would be a warning that such a maneuver is underway. For now, the bottom line is that as long as the market stays above the trend-line the broader trading bias is higher.
Buying here at the highs appears to be a risky endeavor even if the market doesn’t appear set to decline just yet. Shorting, however, appears even more risky as these upward moves in stocks can continue to grind for extended periods that can make for painful trading if on the wrong side.
S&P 500 Daily Chart
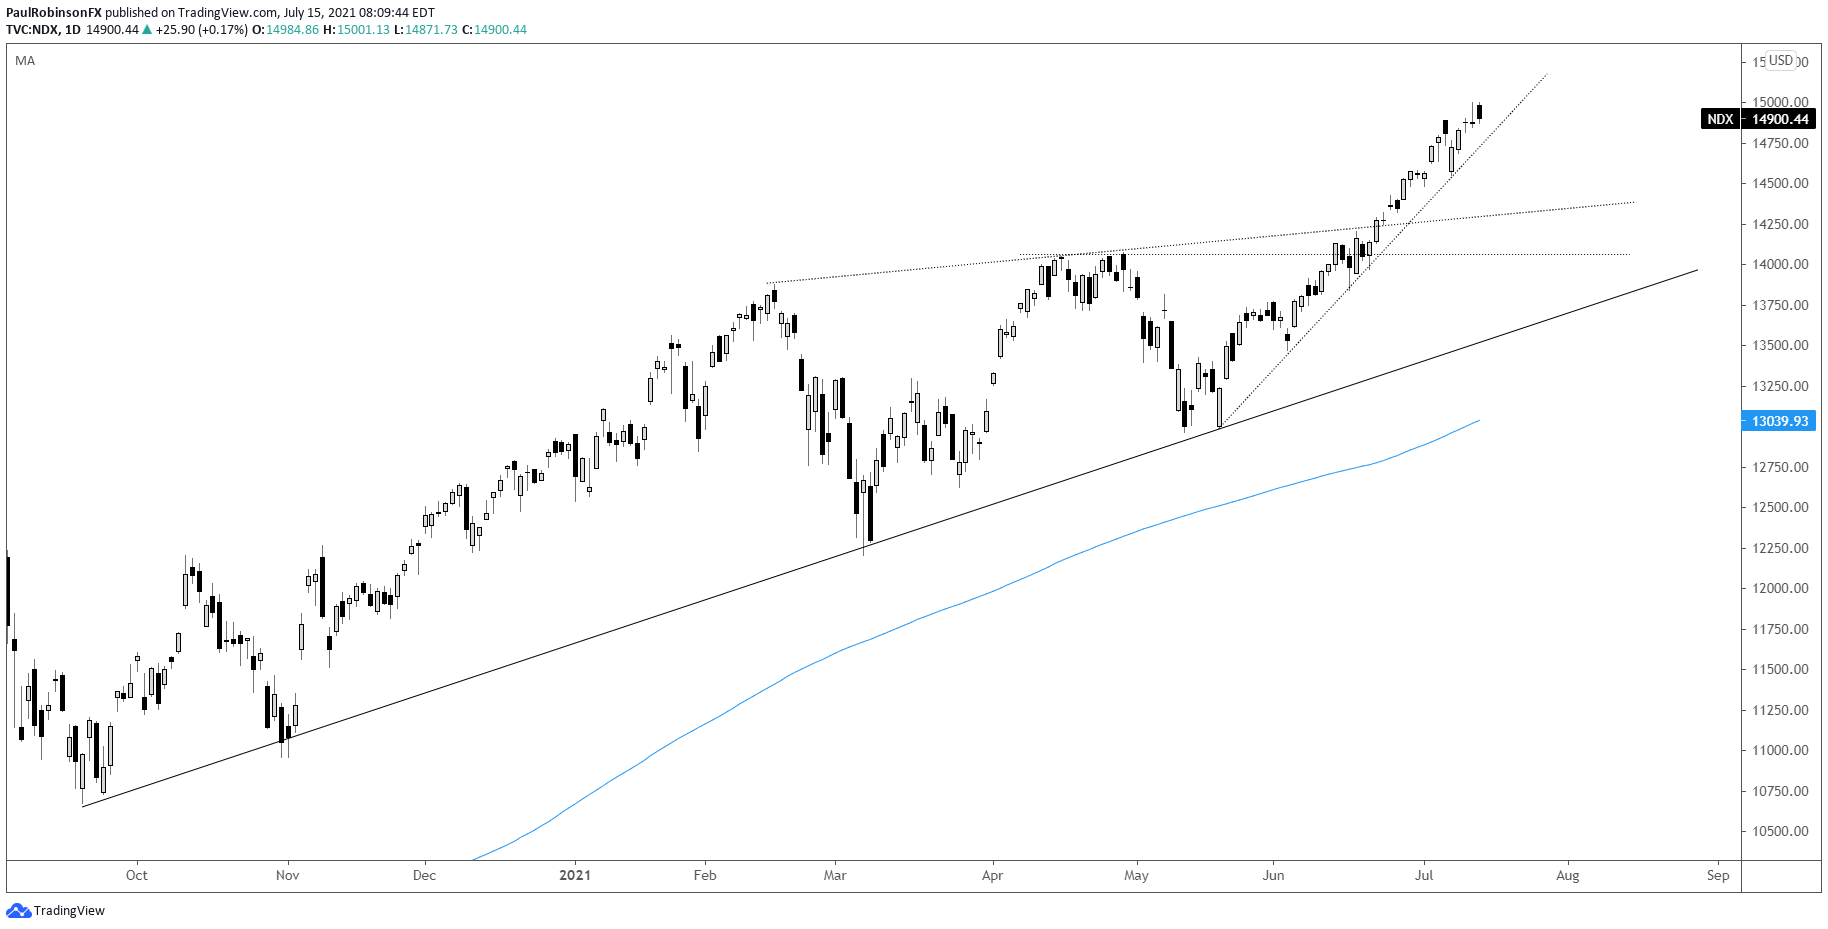
The Nasdaq 100 has rallied from around 12900 to 14900 in just about a straight line. This has growth stocks looking vulnerable to a set-back. There is a steep trend-line from May that if broken may help usher in a decline, but may not amount to more than a pullback.
With that said, a decline could quickly morph into an aggressive move lower and amount to nothing more than a healthy bull market correction. We have seen it on a few occasions since the March 2020 low, so this would be consistent with the recent past.
Should we see a sharp move lower, then watch these levels and lines as spots of potential support; a top-side trend-line around 14400, April high over 14k, and then the slope from September located close to 13700.
Tactically speaking, the outlook is similar to that of the S&P 500 – too high to buy, too strong to short.
Nasdaq 100 Daily Chart
Nasdaq 100 Chart by TradingView
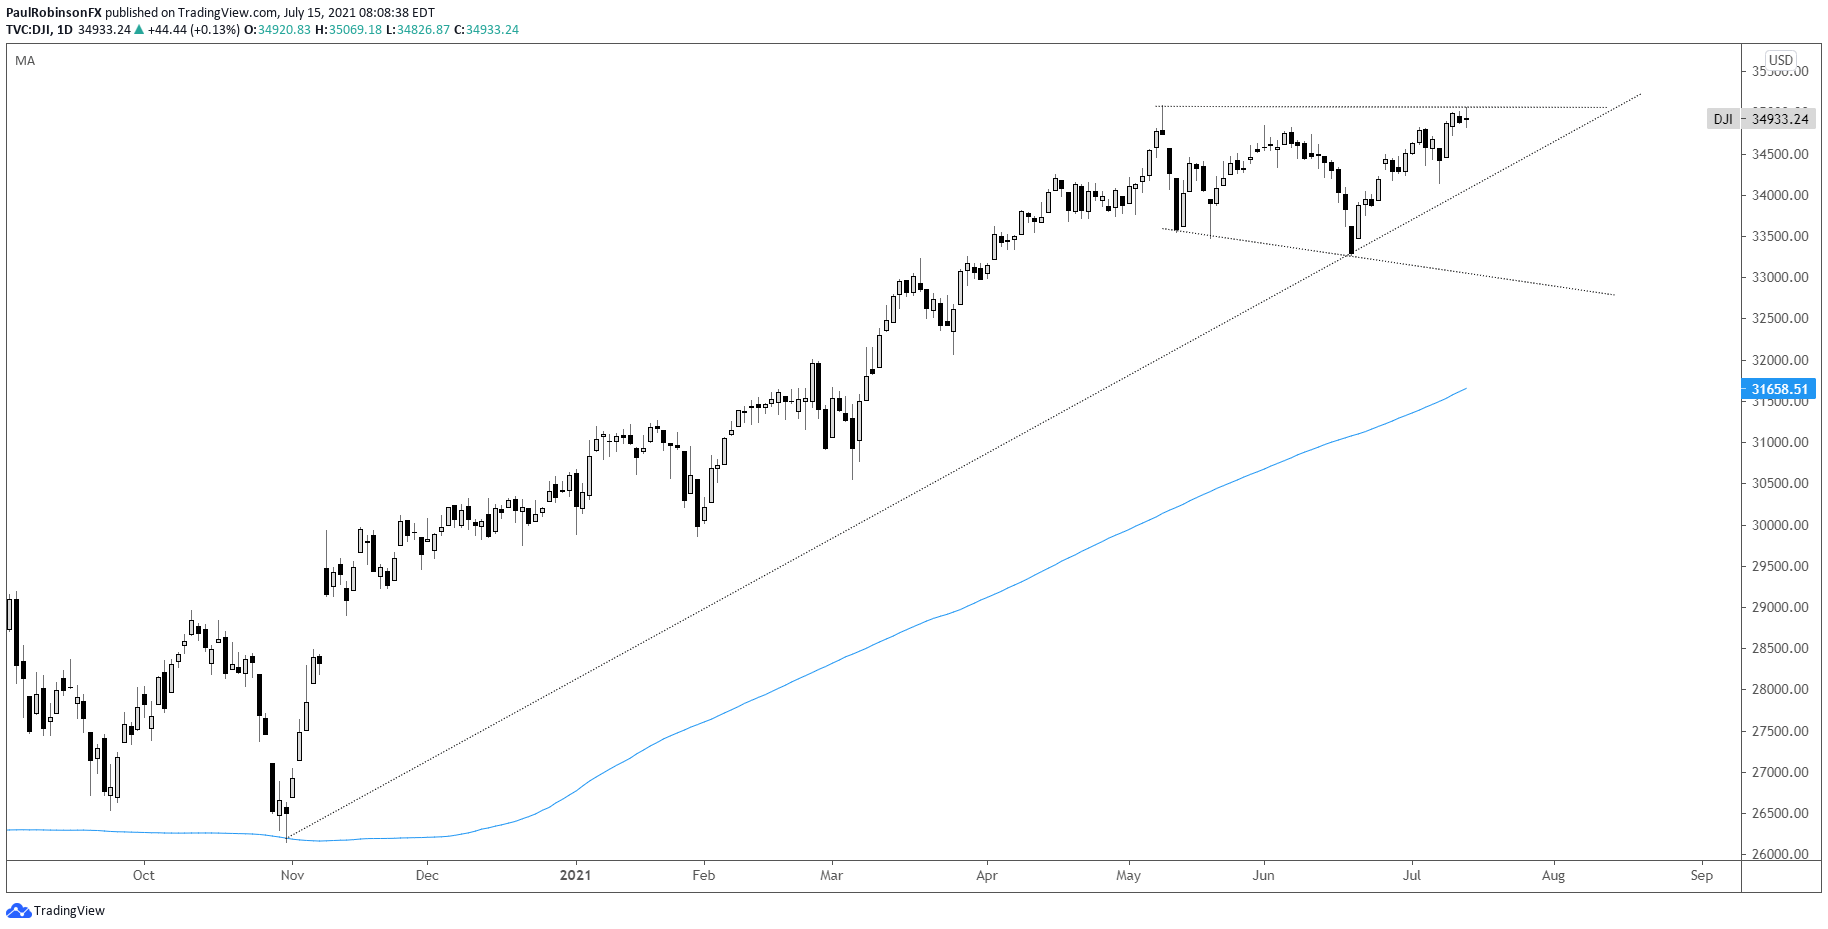
The Dow Jones has been a bit of a laggard as value takes a backseat to growth. It is currently sitting around the high from May. We may see a turn down here but it is unclear how price action will play out. There is a trend-line from October, but it isn’t the sturdiest line of support given it only has the bare minimum that makes up a trend-line.
We could see a rotation here out of growth back into value that sees the Nasdaq 100 lag a bit while the Dow starts to power ahead again. A dynamic that has been in play and expected to be in play over the long haul.
Dow Jones Daily Chart
Dow Jones Chart by TradingView
Resources for Forex Traders
Whether you are a new or experienced trader, we have several resources available to help you; indicator for tracking trader sentiment, quarterly trading forecasts, analytical and educational webinars held daily, trading guides to help you improve trading performance, and one specifically for those who are new to forex.
—Written by Paul Robinson, Market Analyst
You can follow Paul on Twitter at @PaulRobinsonFX


