
S&P 500, CPI, Dollar, USDCAD, GBPUSD and USDCAD Talking Points:
- S&P 500 and other benchmark risk assets continued to hold their tight range and observe the upcoming CPI risk – even CLOV, AMC and GME were tame
- Top event risk over the coming session is definitively the US CPI reading as the focus on Fed’s policy bearings is amplified by the media blackout
- While the impact of the inflation report can be fairly broad depending on its outcome, the Dollar is a particular focus of mine with EURUSD, GBPUSD and USDCAD top of my list
Anticipation Finally Due Its Catalyst
Looking out over the markets for a strong speculative signal this past session, there was very little commitment to be found. Even the high-flying meme stocks were settling – though volumes behind tickers like CLOV, WISH and AMC still surpassed the most liquid stocks and ETFs while GameStop digested an afterhours earnings report. Anticipation is the name of the game with the top listing on the economic calendar due for release in the upcoming session. The US consumer price index (CPI) release for the month of May will weigh in on a heavy fundamental debate around the resilience of the capital market’s incredible build up and its dependency on external forces, most notably stimulus from the likes of the Fed and other major central banks. For the S&P 500, an already restrictive level of activity nestled in exceedingly overt technical levels looks primed for a breakout (a perspective of activity level rather than directionality). The past two months-range is the smallest since September 2018 while the two-week span and ATR move up the risk of a more imminent resolution.
Chart of the S&P 500 with 50 and 100-DMAs, 10-Day Historical Range and ATR (Daily)
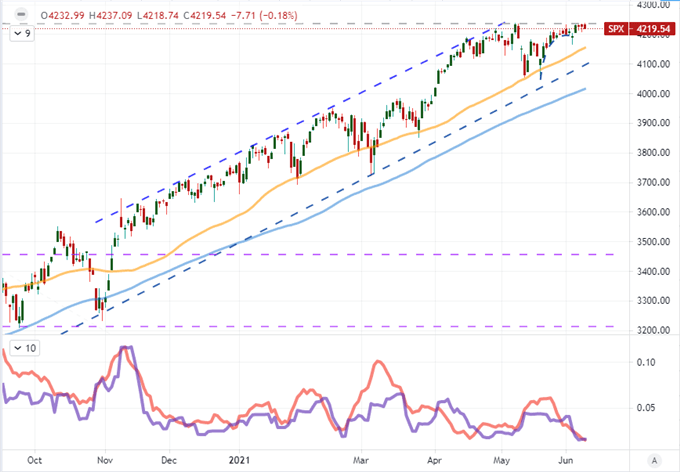
Chart Created on Tradingview Platform
For event risk, there are a few things that are worth marking for the active, global macro trader. However, there is only one indicator that seems to carry the potential to generate breakouts with follow through and to more importantly stretch to global markets. The Fed’s favorite inflation figure is the PCE deflator, but the CPI is the market’s go-to reading on that leg of the central bank’s dual mandate. Price pressures have soared these past months amid the recovery of the US and global economies alongside supply chain issues that have contributed to severe commodity inflation. The message from the Fed is that they believe the inflation to be transitory and thereby it is better to maintain the course on extreme policy to help project the extraordinary economic recovery that the economy is on. However, their rhetoric from last week slowly started to work in acclimation to the possibility that they may announce discussions on taper soon. Then Treasury Secretary (and former Fed Chair) Janet Yellen remarked again over the weekend, during their media blackout period, that it may be wise to tighten policy to prevent an overheated economy. With little official guidance on what the central bank is planning before next Wednesday’s FOMC decision, markets must rely on data points which only magnifies the importance of today’s report.
Chart of US Core CPI and Core PCE Deflator Year-Over-Year (Monthly)
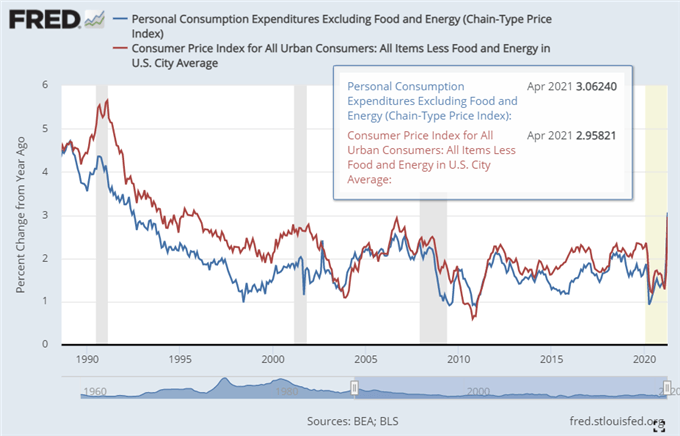
Chart Created on DailyFX
What Markets Stand to Feel the Impact of US Inflation
Typically, I wouldn’t consider the US CPI to be a critical market mover. That said, the contention over where the US central bank is in its monetary policy cycle, its position as a leader for global central banking (look back to December 2015 as they were the first major peer to hike) and the exceptional exposure in risk trends all add up to far too much to lose for the market participants in virtually all corners. That said, there are certain areas on which we should concentrate our focus. Not far from the blast are the likes of the EEM ETF for emerging markets and gold. Exceptional stimulus tends to send funds into the higher return EM market and extremely low yield boosts the appeal of the metal that draws appeal from deflating fiats. Far closer to the impact will be the US 10-Year Treasury yield which notably dropped from its multi-month range over the past 48 hours. That is unusual in a market that is built on anticipation. And of course, one of the most honed tuning forks is the Dollar. The Greenback has struggled with a clear bearing for a week after making a failed attempt to reverse a multi-month tumble. We may be looking at some post CPI charge, but remember that the market will still be looking a little further out to the FOMC decision.
Chart of DXY Dollar Index with 20 and 100-DMAs Overlaid with US 10-Year Yield (Daily)
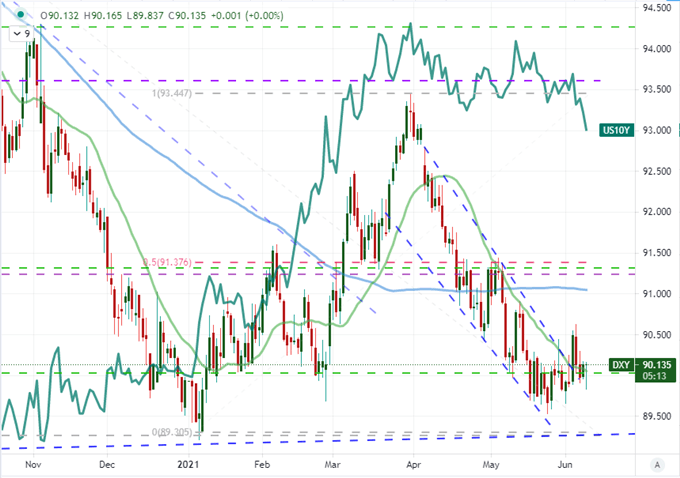
Chart Created on Tradingview Platform
The USD Majors On Top of My List
Given how exposed the US Dollar is to the upcoming event risk, there is potential for all of its pairings. However, I prefer to source those pairs that have better technical and fundamental credibility for which we can find greater amplitude. Perhaps one of the more comprehensive crosses is USDCAD. I was watching this pair closely over the past session as the 20-day range and ATR pushed to extreme levels with extraordinary technical support and the Bank of Canada (BOC) decision on tap. Ultimately, the Canadian authority would fail to trigger the market before the US data could hit the wires as they decided to offer a neutral message following their very market-moving decision to taper at the last meeting.
Chart of USDCAD with 100-DMA with 20-Day ATR (Daily)
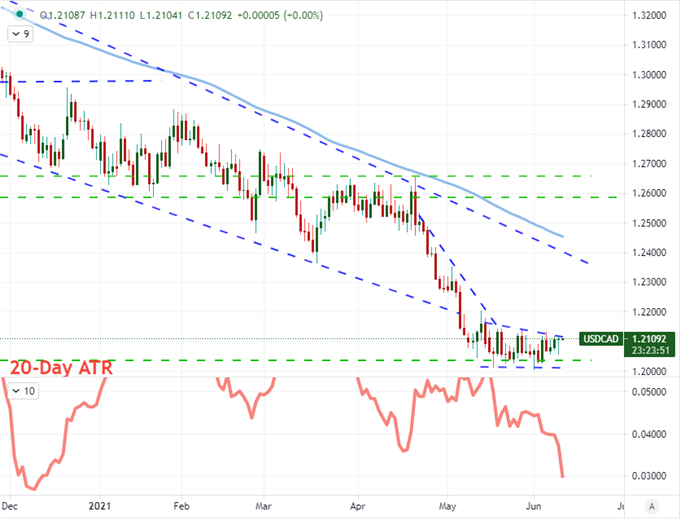
Chart Created on Tradingview Platform
Another major that I will be watching closely will be the GBPUSD. On a technical basis, the picture is almost as pressurized as what we are seeing with USDCAD. To the topside of recent price action is the midpoint of the 2014-2020 range at 1.4300. The past month has developed a head-and-shoulders pattern which is will lead some of the technically-inclined to see scope in the reversal pattern should the fundamentals offer motivation. Further, the Sterling itself has come under pressure this past session as tensions between the UK and EU have flared up on their post-Brexit criteria. This is still a modest pressure, however, so the Dollar would likely still have to do the heavy lift for a true move.
Chart GBPUSD 50 and 100-Day Moving Averages and 15-Day Historical Range (Daily)
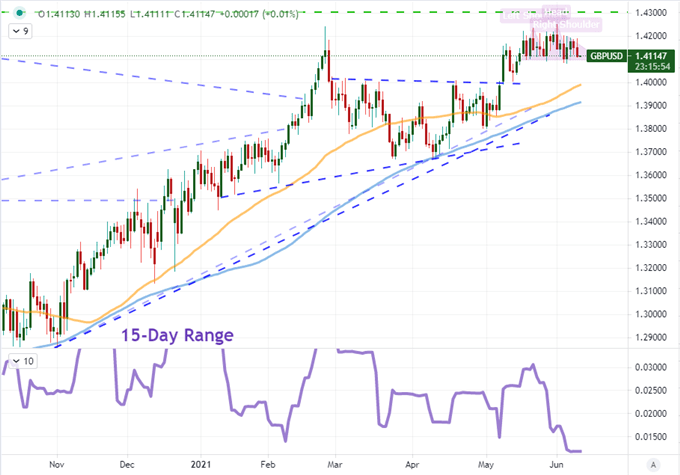
Chart Created on Tradingview Platform
For technicals, EURUSD is one of the last appealing of the majors. There are Fibonacci levels in the 1.2200 to 1.2100 area, but price action this past month has all but negated its clout. Major levels at 1.2350 (the high for the past three years) and 1.2100 (50-day moving average and range low) can give way to more significant follow through, but we need to get to those boundaries first. That said, the past month’s range and realized volatility are extremely low. Furthermore, there is the strongest counter currency fundamental influence on offer with EURUSD. The ECB rate decision will hit the wires shortly before the US CPI. If both events are interpreted as being bullish or bearish for their respective currencies, it could offset and curb meaningful movement. Alternatively, if the inflation indicator bolsters the taper debate for the Fed while the ECB leans into its dovish commitment, boilerplate from the latter could stand out as an amplifier for the former resulting in a bigger market move.
Chart of EURUSD with 50-Day Moving Average and 15-Day Historical Range (Daily)
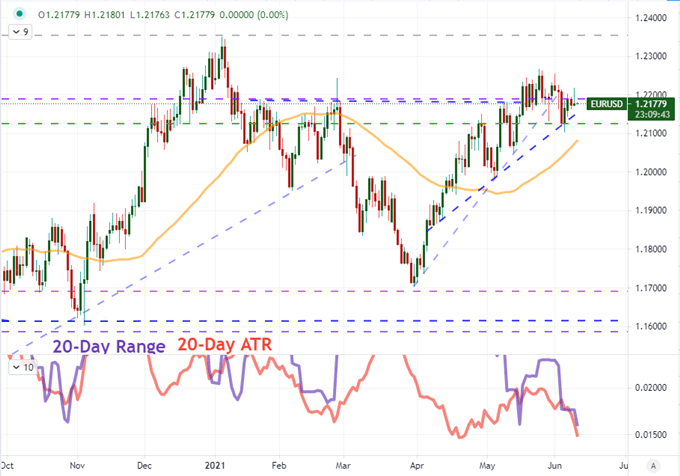
Chart Created on Tradingview Platform
.