S&P 500, AMC, GME, CPI, Dollar, USDCAD and GBPUSD Talking Points:
- Despite a larger-than-expected surge in US consumer inflation (CPI) the market didn’t seem to extrapolate – or fear – Fed tightening implications
- The S&P 500 notched a record high in the technical sense but risk appetite was absent with even AMC and GME sliding; while the US Dollar failed to break its extreme ranges
- Market conditions are holding conditions in check with the FOMC on Wednesday the next big milestone, but I’ll keep an eye on a record tight GBPUSD range
The S&P 500 Hits a Record High But There Was Little Risk Appetite Aside From That
The US consumer price index (CPI) report for May has come and gone with data that managed to outpace even the high water market for expectations. If markets operated in a textbook fashion, the implications for a forward shifted monetary policy response from the Federal Reserve would have sent mature risk trends reeling and the US Dollar would have recovered from its multi-month slide. Neither of those scenarios would come to pass however. In fact, both sentiment and currency seemed to be little fazed by the data. If technicals are charged and fundamentals provide impetus yet the markets refuse to respond, it may point to a few considerations. I could have just misinterpreted the data, but this was fairly straightforward. Markets may be positioned to only metabolize favorable news – but then their was no follow through on the most responsive risk assets. The S&P 500 may have notched a technical record high, but there was little enthusiasm for anything to follow. Further, the meme stocks like AMC, GME and CLOV which rallied while everything else lied dormant actually lost altitude. This seems a factor of market conditions.
Chart of the S&P 500 Overlaid with AMC and GME (Daily)
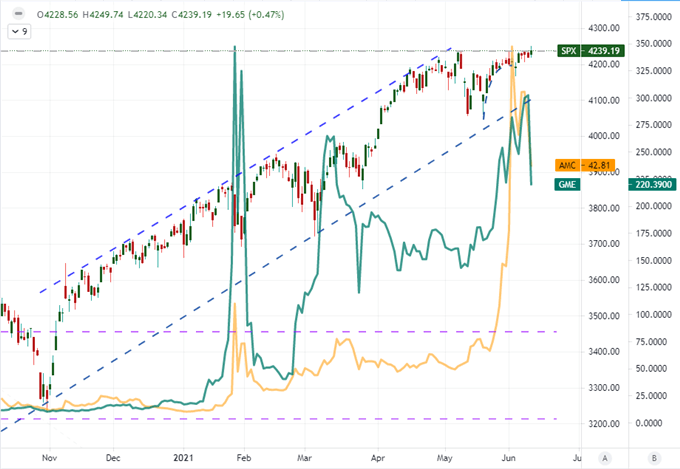
Chart Created on Tradingview Platform
I believe the influence of volume, volatility and sentiment across in a particular asset all the way up to the global financial system deserve a different designation analytically. Market conditions have shown a steady, structural slide in both volume and volatility over the these past months even as risk benchmarks extended their climb. That is in part extended normalization from the extremes after the pandemic struck more than a year ago, but at a certain point the pendulum passed the point of balance and swung to the stretched complacency extreme. It is certainly possible that we have entered the doldrums early and volatility will only come in short-lived fits for the time being. Yet, I don’t find comfort in a market that is built on excess leverage and exogenous support when the purveyors of buoyancy (central banks) are trying to look for an off ramp.
Chart of the VIX Volatility Index Overlaid with S&P 500 ETF Volume (Weekly)
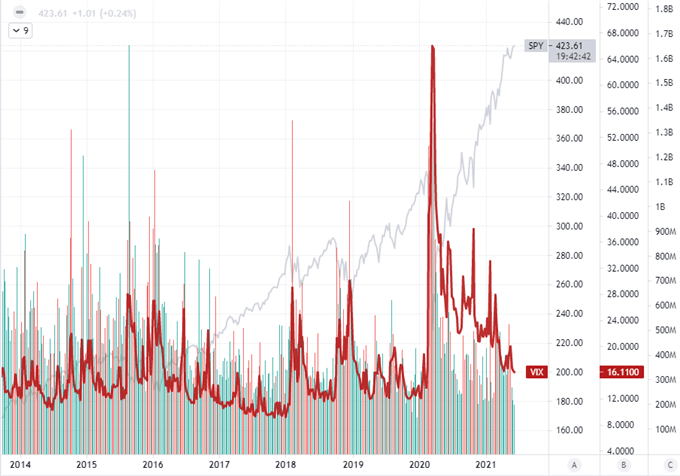
Chart Created on Tradingview Platform
Inflation Will Cause the Fed More Trouble Next Week
Considering the inflation data this past session, it is important to carry forward the implications rather than simply writing off as an underwhelming market mover. A 5.0 percent headline and 3.8 percent core year-over-year CPI reading handily cleared expectations (4.7 and 3.4 percent respectively) and hit historical highs (2008 and 1992). There is a strong argument that a significant portion of this price pressure is transitory as the Fed has chanted. New and used vehicles, gasoline and food prices are likely to come down in the second half of the year while supply-chain issues are likely to alleviate. That said, the figures are likely to remain above target for the indeterminable future. Further, it is worth considering the Fed’s perspective. They are clearly not running on a binary assumption of hitting the dual mandate, but are also looking to maintain the ability shift policy in either direction without the threat of a speculative panic or mania. As we saw back in 2013 through 2015, the most difficult step in pulling back from the extremes of accommodation is to first acclimate the market to the inevitability of normalizing. If the inflation data wasn’t enough for the Fed to shift its dot plot and announce that discussions have started on when and how to start the taper, the market’s quiet in response to the release likely push it over the edge.
Chart of US Consumer Price Index and Core CPI (Monthly)
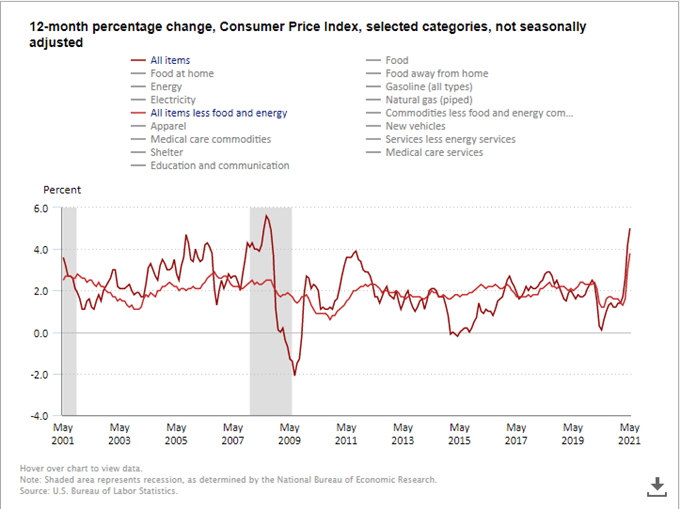
Chart from US Bureau of Labor Statistics
If risk assets were unruffled by the possibility of a change to the Fed’s message next week, it should be no surprise that the deflated US Dollar would not benefit as a safe haven. That said, the market’s perspective on the data (sentiment) doesn’t necessarily mean that the markets would remain aloof to the possibility of firmed yield forecasts as taper potential rises. Nonetheless, the DXY Dollar Index wouldn’t be able to hold on to the modest gains it fronted intraday. What was even more remarkable is that the assets that more directly align to forward rate speculation actually extended losses. The US 10-Year Treasury Yield slid to three-month lows while the difference between the December 2023 and ‘active nearby’ Fed Funds futures contracts is pricing in less than a 50 percent chance of one hike by the end of next year. It doesn’t seem that the market had too much premium going into the data, so a slide like this before the FOMC next week could very well set the stage for even modest hawkish surprises charging a strong rally.
Chart of DXY Dollar Index with 100-DMAs Overlaid with US 10-Year Yield (Daily)
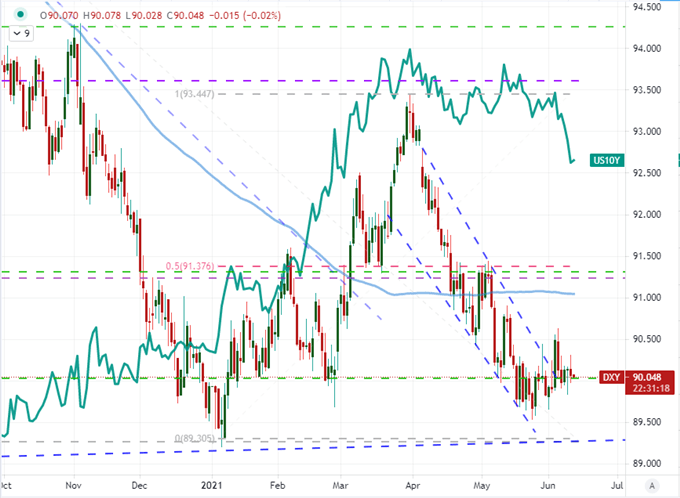
Chart Created on Tradingview Platform
Two Dollar Crosses with a Breakout Look But Different Friday Potential
With the dud from the economic docket, we are left with extraordinarily restrictive trading conditions on various assets that already look overdue for normalizing. It is possible that some of these markets and pairs hold their impressively restrained ranges until we reach next week’s top listing, but the risks remain that thin markets or the unforeseen development pushes the boundaries – even if for a break of ‘necessity’ rather than intent. One pair I have been watching closely and will continue to do so is USDCAD whose 20-day (one month) historical range as a percentage of spot is the most stringent congestion since February of last year and the fourth smallest back to the turn of the century. I will be watching the US University of Michigan Consumer Confidence survey to see if that poses any last minute risk of unseating this pattern.
Chart of USDCAD with 50 and 100-DMA with 20-Day Historical Range (Daily)
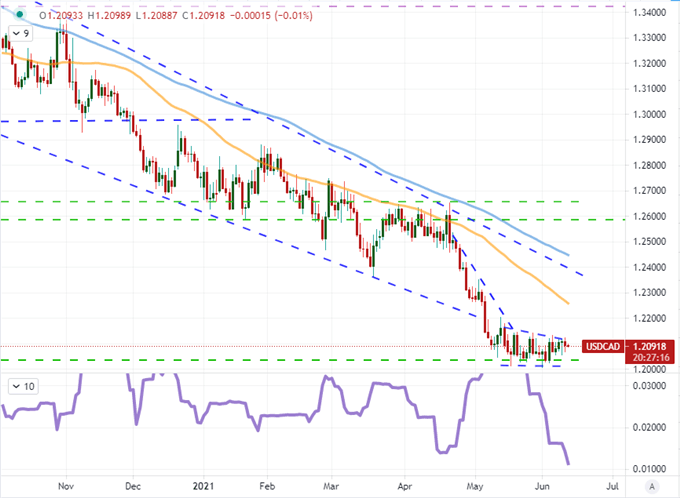
Chart Created on Tradingview Platform
If there is any Dollar-based cross that can up the scheduled event risk ante, it would be GBPUSD. In addition to the US data, we are also due April GDP, trade balance and industrial production for the United Kingdom. There is also the ongoing G7 summit hosted by the UK and there have been plenty of headlines for the region – both good such as the US-UK warmed relations and bad with concerns of a breakdown in EU-UK post-Brexit relations. Technically speaking, the 20-day historical range on the Cable is even more extraordinary. The head-and-shoulders pattern just below the midpoint of the 2014-2020 bear trend is the smallest 1-month trading hold I have on record.
Chart GBPUSD 50 and 100-Day Moving Averages and 20-Day Historical Range (Daily)
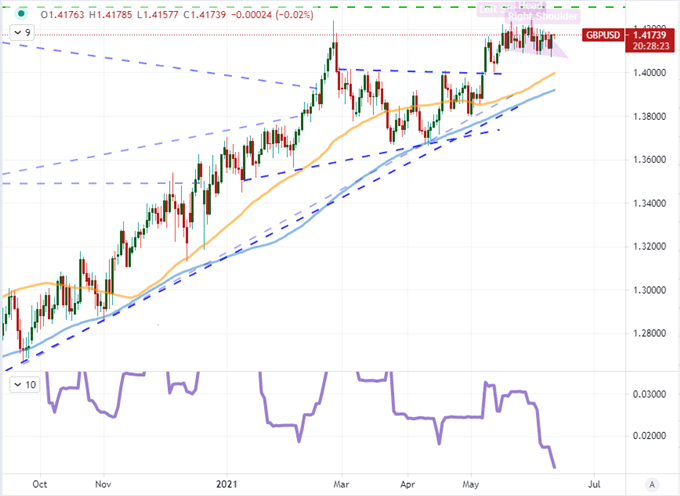
Chart Created on Tradingview Platform
.