
- Tesla shares continue to steadily appreciate eyeing $667 resistance.
- TSLA breaks 21-day moving average resistance.
- TSLA supported by strong retail sentiment returning to equities.
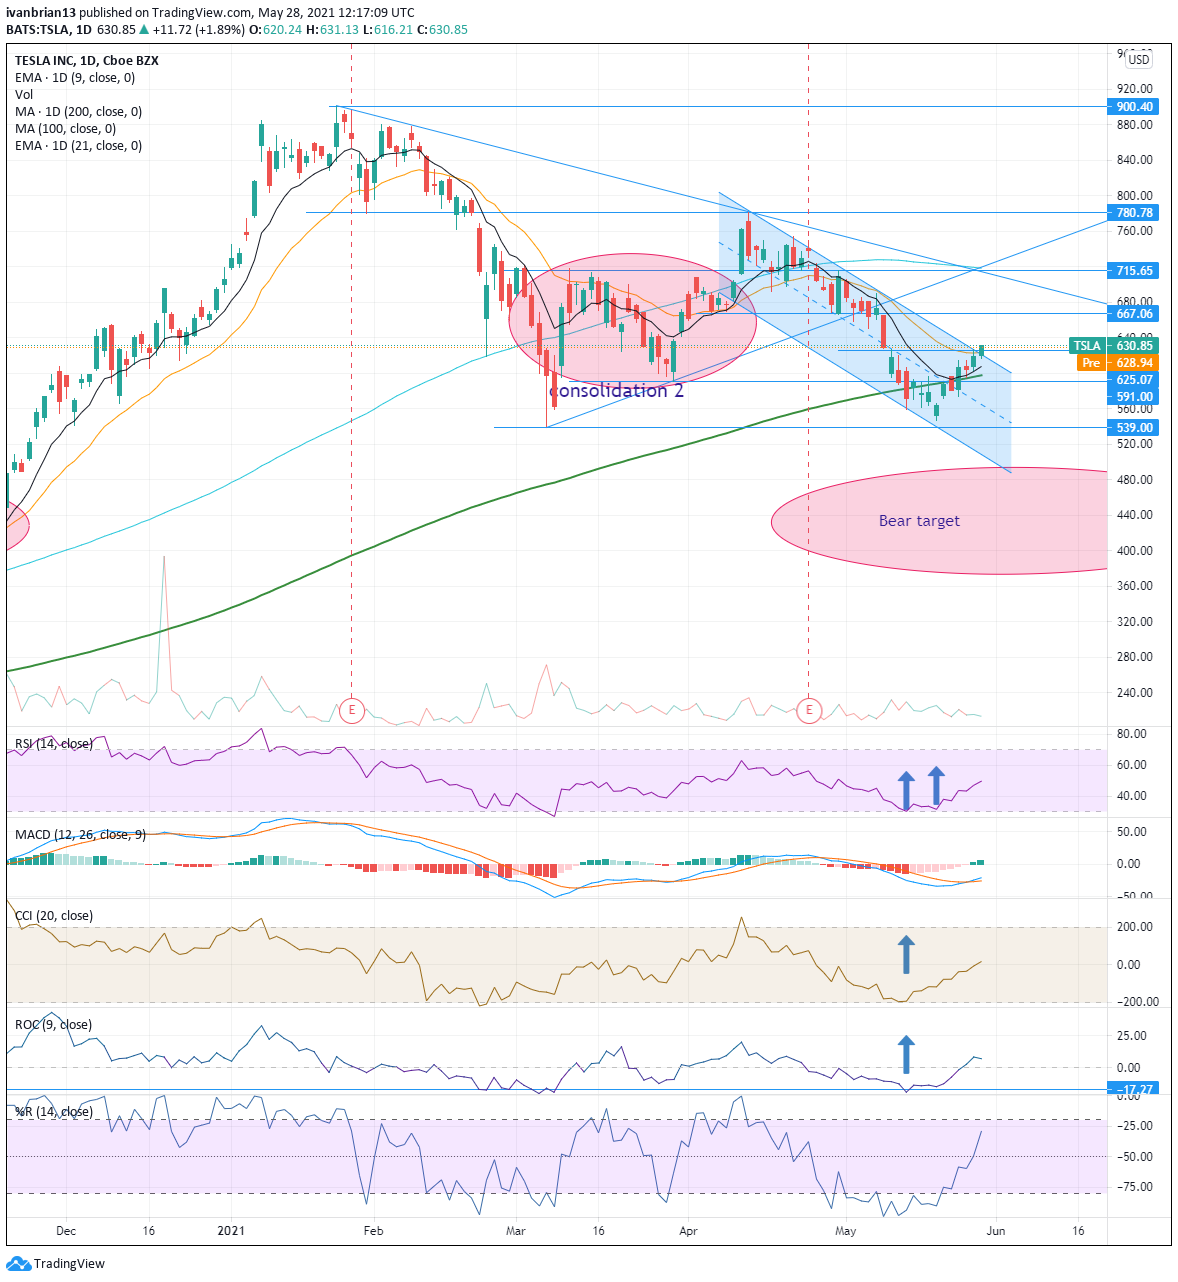
Tesla shares are continuing to move nice and steadily higher, eschewing the surging retail rally in favour of a more considered move. Understandable given its part of the S&P 500 now making AMC style rallies a thing of the past. Even so, TSLA has totally turned around from the bearish tone witnessed earlier in May when it looked like the stock would breach $500. The catalysts were the Fed finally making believers out of the market that it is ahead of the inflation curve and not about to drop the ball (the ball being the markets back). Tech and high grwoth stocks immediately liked what they heard from the Fed and turned around. Tesla obviously fitted into both tech and growth categories and headed north. Perhaps more tellingly were the strong support zones witnessed in a number of big tech names with Apple, Amazon, Facebook, and others all having retraced to strong regions of price support. Tesla was no different, retracing back to its 200-day moving average before breaking and trading close to the $539 low from March 5. On May 19 Tesla looked increasingly bearish having broken clearly from the 200-day moving average and traded as low as $546.98. However the momentum oscillators, the Relative Strength Index (RSI), Commodity Channel Index (CCI) and the Williams %R all combined for a strongly overbought signal. No indicator is perfect but a combination of indicators giving the same signal is closer to perfect and Tesla duly turned itself around. From this $546 low Tesla has retraced all the way back to $630 and now has the key $667 resistance in its sights. Tesla has also broken out of its recent down trending channel.
Where to from here? Well in the short term everything looks rosy for the broad indices in general with the Fed seemingly convincing market participants that all is well, go forth and prosper and be long Obi-Wan. Economic data is thin on the ground this week so bears do not have many arguments to make and retail momentum is back in equities in a big way, having deserted the crypto ship for now.
Tesla has broken the 9 and 21-day moving averages, always nice guides to the short term trend. The shares have also, as mentioned, seen nice buy signals from the momentum oscillators and the Moving Average Convergence Divergence (MACD) has given a crossover buy signal on Thursday. The MACD is notoriously lagging though. What is more interesting is the move toward resistance at $667 and the channel breakout. Volume on the breakout was not high (AMC took all the volume) but the momentum is bullish so long as $591 is below us. This $591 is once again strong support with the 200-day moving average having edged up here. Breaking $667 would end the series of lower highs and lows in evidence since the April highs.
| Support | 625 | 607 9-day MA | 591 key | 539 | 500 |
| Resistance | 667 key | 715 | 781 | 900.40 |
At the time of writing, the author has no position in any stock mentioned in this article and no business relationship with any company mentioned. The author has not received compensation for writing this article, other than from FXStreet.
This article is for information purposes only. The author and FXStreet are not registered investment advisors and nothing in this article is intended to be investment advice. It is important to perform your own research before making any investment and take independent advice from a registered investment advisor.
FXStreet and the author do not provide personalized recommendations. The author makes no representations as to accuracy, completeness, or the suitability of this information. FXStreet and the author will not be liable for any errors, omissions or any losses, injuries or damages arising from this information and its display or use. The author will not be held responsible for information that is found at the end of links posted on this page.
Errors and omissions excepted.