The U.S. housing market continues to roll along, fed by an increased appeal of suburban and rural living during the COVID-19 pandemic, as well as low interest rates.
Home builders and related companies have hitched a ride. And even though it can take years for home builders to make the deals and get approvals needed to begin large new projects, pricing pressure means improved profit margins.
In this article, we’ll first look at publicly traded home builders and then take a screen of Wall Street’s favorite housing-related stocks by reviewing four ETFs that hold shares of builders, building suppliers, home-improvement retailers, land developers and other companies that provide services in the industry.
S&P home builders
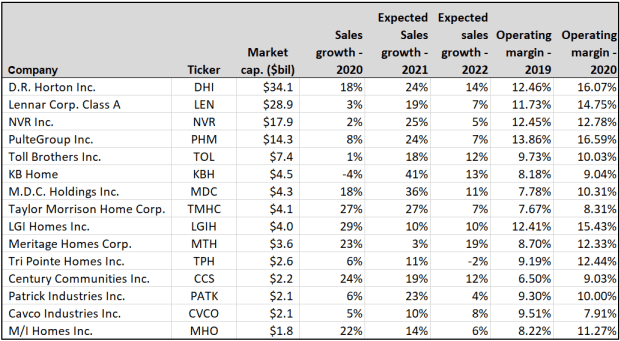
Here are the 15 home builders included in the S&P 1500 Composite Index
SP1500,
+0.01%,
sorted by market capitalization:
(FactSet)
The data are for calendar years. Some sales figures for 2020 are estimated by analysts for companies with fiscal years or quarters that don’t match the calendar. You can see that seven of the 15 builders increased sales by double digits during 2020, but that all of them improved their operating margins (profit margins before interest and taxes). That shows the effect of pricing power and low interest rates.
The largest builder by market capitalization, D.R. Horton Inc.
DHI,
-1.82%,
is expected to maintain a double-digit revenue growth rate this year and in 2022.
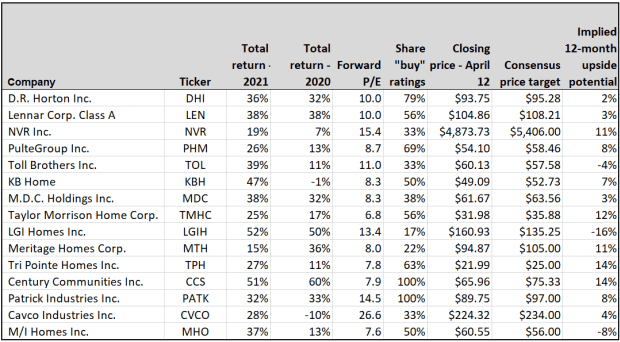
Leaving the list of builders in the same order, take a look at this stock data:
(FactSet)
All the stocks are up by double digits this year, following good performance, for most, in 2020. But the forward price-to-earnings ratios, based on consensus earnings estimates among analysts polled by FactSet for the next 12 months, are low for most of the companies. In comparison, the forward P/E for the S&P 1500 is 22.5 and for the S&P 500
SPX,
+0.11%
it is 22.8.
Even though the analysts look out to 2022 for sales estimates (as you can see in the first table), their price targets and ratings are based only on what they expect over the next 12 months. So for many of these stocks, the analysts expect the market to take a breather, even though they see good times continuing in 2022.
A broad approach to playing the housing trend
Home builders are only part of the story for investors who wish to play the U.S. housing boom. Home Depot Inc.
HD,
-0.85%
alone has a market cap of $345 billion, compared with a combined market cap of $134 billion for the 15 home builders listed above.
To come up with a broad list of housing-related companies, we looked at four exchange traded funds.
-
The largest is the iShares U.S. Home Construction ETF
ITB,
-1.66%,
which has $2.7 billion in assets and annual expenses of 0.42% of assets. This ETF holds 45 stocks weighted by market cap and is heavily concentrated, with the top five making up 47% of the portfolio and the top 10 making up 65%. The four largest home builders listed above are the ETF’s top holdings: D.R. Horton, Lennar Corp.
LEN,
-2.25%,
NVR Inc. and PulteGroup Inc., followed by Home Depot. -
The SPDR S&P Homebuilders ETF
XHB,
-1.34%
has $1.8 billion in assets with an expense ratio of 0.35%. The is less concentrated than ITB, with the top five stocks making up 21% of the portfolio and the top 10 accounting for 41%. According to FactSet, XHB “tilts away from companies that dominate the [home building] industry.” -
The Invesco Dynamic Building & Construction ETF
PKB,
-1.33%
has $258 million in assets, an expense ratio of 0.59% and holds 30 stocks. According to FactSet, its “tiered weighting scheme creates a small-cap tilt.” -
The Hoya Capital Housing ETF
HOMZ,
-0.72%
has $61 million in assets, with the lowest expense ratio of 0.30%. What also sets it apart is that it holds 100 stocks in four segments: U.S. home ownership and rental; home building and construction; home improvement and furnishings; and home financing, technology and services.
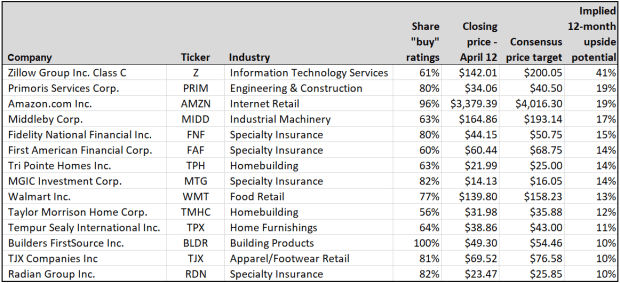
Stacking up the four funds’ holdings and removing duplicates produced a list of 140 companies. Here are the 14 covered by at least five analysts that have majority “buy” or equivalent ratings and double-digit 12-month upside implied by consensus price targets:
(FactSet)
Zillow Group Inc.
Z,
+1.32%
tops the list as it continues to transform the way home buyers and sellers interact. It might surprise you to see Amazon.com Inc.
AMZN,
+1.44%
and Walmart Inc.
WMT,
-0.36%
on the list as well, but there’s no question that if you are buying a home or improving one, you have a good chance of making use of both retailers.
As always, you should do your own research before making any investment. You can learn more about the stocks and ETFs in this article by searching on their tickers at the top right of this page.
Here’s a sampling of Jacob Passy’s coverage of the dynamic U.S. housing market: