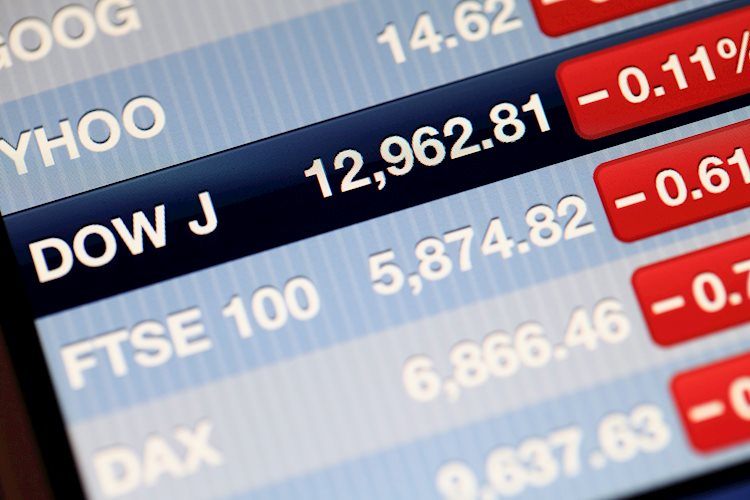
Markets are licking their wounds, with most equity indices in the red across the globe.
The US Dollar Index falls back to the mid-104.50 level.
The US Dollar (USD) sees its gains dampen a bit with dust settling over comments from the Federal Reserve (Fed) Bank of Minneapolis President Neel Kashkari, who spooked markets on Tuesday. Kashkari suggested that a rate hike could still be a possibility this year. Markets ignored that Kashkari is a non-voter this year and can thus speak a little bit more freely and personally, together with his closing remark that he does not see a hike as a possible outcome for now.
On the economic data front, Wednesday’s focus is on the Richmond Fed Manufacturing index for May. Markets have already seen the Dallas Fed Manufacturing number sink further to -19.4 in May from -14.5. Another lower-than-expected Manufacturing Index could mean more easing ahead for the Greenback, with markets rejecting completely the rate hike possibility from Kashkari.
At 11:00 GMT, the Mortgage Applications got released by the Mortgage Bankers Association for the week of May 24. The previous week’s data was a positive 1.9% with a firm contraction this week by 5.7%.
At 12:55 GMT, the Redbook Index for the week of May 24 will come out. The previous week’s reading was at 5.5%.
At 14:00 GMT, the Richmond Fed Manufacturing Index for May will be released. The previous reading was -7, with a smaller improvement to -2 expected. As mentioned above, the importance of this number has been lined out with the chunky contraction seen on Tuesday in the Dallas Fed Manufacturing data.
The US Treasury is set to auction a 7-year Note around 17:00 GMT.
Federal Reserve Bank of New York President John Williams participates in a roundtable with local leaders about community services at an event organized by the Development Authority of the North Country in Watertown. Comments are expected around 17:45 GMT.
The Fed’s Beige Book is to be released at 18:00 GMT.
At 23:00 GMT, Federal Reserve Bank of Atlanta President Raphael Bostic participates in a moderated conversation about leadership and the US economic outlook at the Thirteenth Annual AEA Conference on Teaching and Research in Economic Education.
Both in the Asian-Pacific and the European session, the main equity indices are in the red. However, losses in Europe remain contained to an average of 0.50%.
According to the CME Fedwatch Tool, Fed Fund futures pricing data suggests a 53.7% chance for keeping rates unchanged in September, against 41.7% chance for a 25 basis points (bps) rate cut and 4.1% chance for an even 50 bps rate cut. A marginal 0.5% price in an interest rate hike, and it has not really increased in odds despite Fed’s Kashkari comments.
The benchmark 10-year US Treasury Note trades around 4.56% and peaks for this week.
The US Dollar Index (DXY) played with fire on Tuesday after testing the lower and last support level in the current range. The 100-day Simple Moving Average (SMA) did its part around 104.34, and sent the DXY in a turnaround back up above 104.50. The question will be how long it will last, with the focus shifting to the Q1 US Gross Domestic Product (GDP) second estimate numbers on Thursday and the Personal Consumption Expenditures (PCE) Price Index for April on Friday.
On the upside, the DXY index needs to reclaim key levels it lost last week: the 55-day Simple Moving Average (SMA), currently at 104.82, and the 105.00 big round level. Further up, the following levels to consider are 105.12 and 105.52.
On the downside, the 200-day SMA at 104.42 and the 100-day SMA around 104.34 are the last line of defence. Once that level snaps, an air pocket is placed between 104.30 and 103.00. Should the US Dollar decline persist, the low of March at 102.35 and the low from December at 100.62 are levels to consider.
In the world of financial jargon the two widely used terms “risk-on” and “risk off” refer to the level of risk that investors are willing to stomach during the period referenced. In a “risk-on” market, investors are optimistic about the future and more willing to buy risky assets. In a “risk-off” market investors start to ‘play it safe’ because they are worried about the future, and therefore buy less risky assets that are more certain of bringing a return, even if it is relatively modest.
Typically, during periods of “risk-on”, stock markets will rise, most commodities – except Gold – will also gain in value, since they benefit from a positive growth outlook. The currencies of nations that are heavy commodity exporters strengthen because of increased demand, and Cryptocurrencies rise. In a “risk-off” market, Bonds go up – especially major government Bonds – Gold shines, and safe-haven currencies such as the Japanese Yen, Swiss Franc and US Dollar all benefit.
The Australian Dollar (AUD), the Canadian Dollar (CAD), the New Zealand Dollar (NZD) and minor FX like the Ruble (RUB) and the South African Rand (ZAR), all tend to rise in markets that are “risk-on”. This is because the economies of these currencies are heavily reliant on commodity exports for growth, and commodities tend to rise in price during risk-on periods. This is because investors foresee greater demand for raw materials in the future due to heightened economic activity.
The major currencies that tend to rise during periods of “risk-off” are the US Dollar (USD), the Japanese Yen (JPY) and the Swiss Franc (CHF). The US Dollar, because it is the world’s reserve currency, and because in times of crisis investors buy US government debt, which is seen as safe because the largest economy in the world is unlikely to default. The Yen, from increased demand for Japanese government bonds, because a high proportion are held by domestic investors who are unlikely to dump them – even in a crisis. The Swiss Franc, because strict Swiss banking laws offer investors enhanced capital protection.
Share:
Feed news
Information on these pages contains forward-looking statements that involve risks and uncertainties. Markets and instruments profiled on this page are for informational purposes only and should not in any way come across as a recommendation to buy or sell in these assets. You should do your own thorough research before making any investment decisions. FXStreet does not in any way guarantee that this information is free from mistakes, errors, or material misstatements. It also does not guarantee that this information is of a timely nature. Investing in Open Markets involves a great deal of risk, including the loss of all or a portion of your investment, as well as emotional distress. All risks, losses and costs associated with investing, including total loss of principal, are your responsibility. The views and opinions expressed in this article are those of the authors and do not necessarily reflect the official policy or position of FXStreet nor its advertisers. The author will not be held responsible for information that is found at the end of links posted on this page.
If not otherwise explicitly mentioned in the body of the article, at the time of writing, the author has no position in any stock mentioned in this article and no business relationship with any company mentioned. The author has not received compensation for writing this article, other than from FXStreet.
FXStreet and the author do not provide personalized recommendations. The author makes no representations as to the accuracy, completeness, or suitability of this information. FXStreet and the author will not be liable for any errors, omissions or any losses, injuries or damages arising from this information and its display or use. Errors and omissions excepted.
The author and FXStreet are not registered investment advisors and nothing in this article is intended to be investment advice.