

USD/CNH, Copper News and Analysis
Worse than expected Chinese data confirms reopening challengesUSD/CNH: Dollar selloff provides bulls with potential re-entry into bullish trendCopper: Worrying Chinese data sends copper sharply lowerThe analysis in this article makes use of chart patterns and key support and resistance levels. For more information visit our comprehensive education library
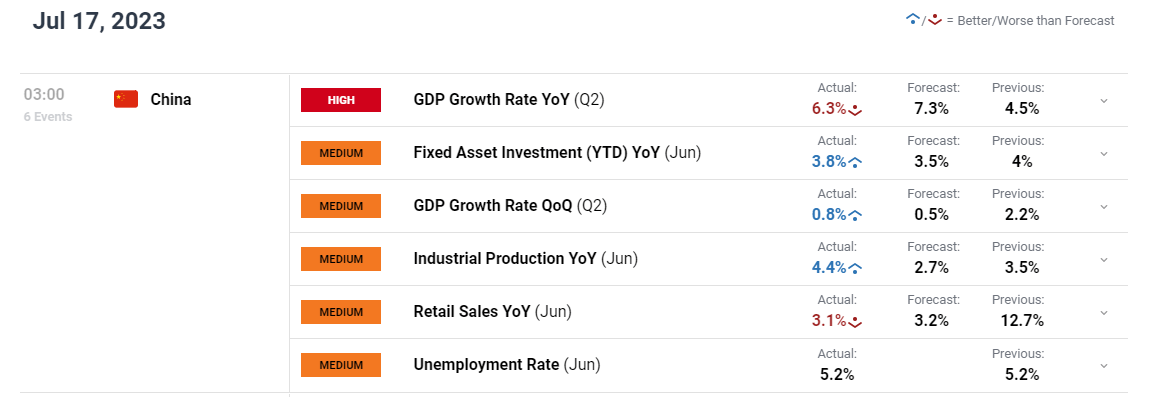
Worse Than Expected Chinese Data Confirms Reopening Challenges
The Chinese economy grew by 6.5% in Q2 compared to the same period last year when China was still experiencing targeted lockdowns which had hamstrung the local economy. The 6.3% figure fell short of the 7.3% forecast as China attempts to reach the government’s rather conservative target of “around 5%” GDP growth for the year.
It wasn’t all bad news as industrial production for June picked up much faster than projected and quarter on quarter GDP growth is headed in the right direction even if progress is slow.
Customize and filter live economic data via our DailyFX economic calendar
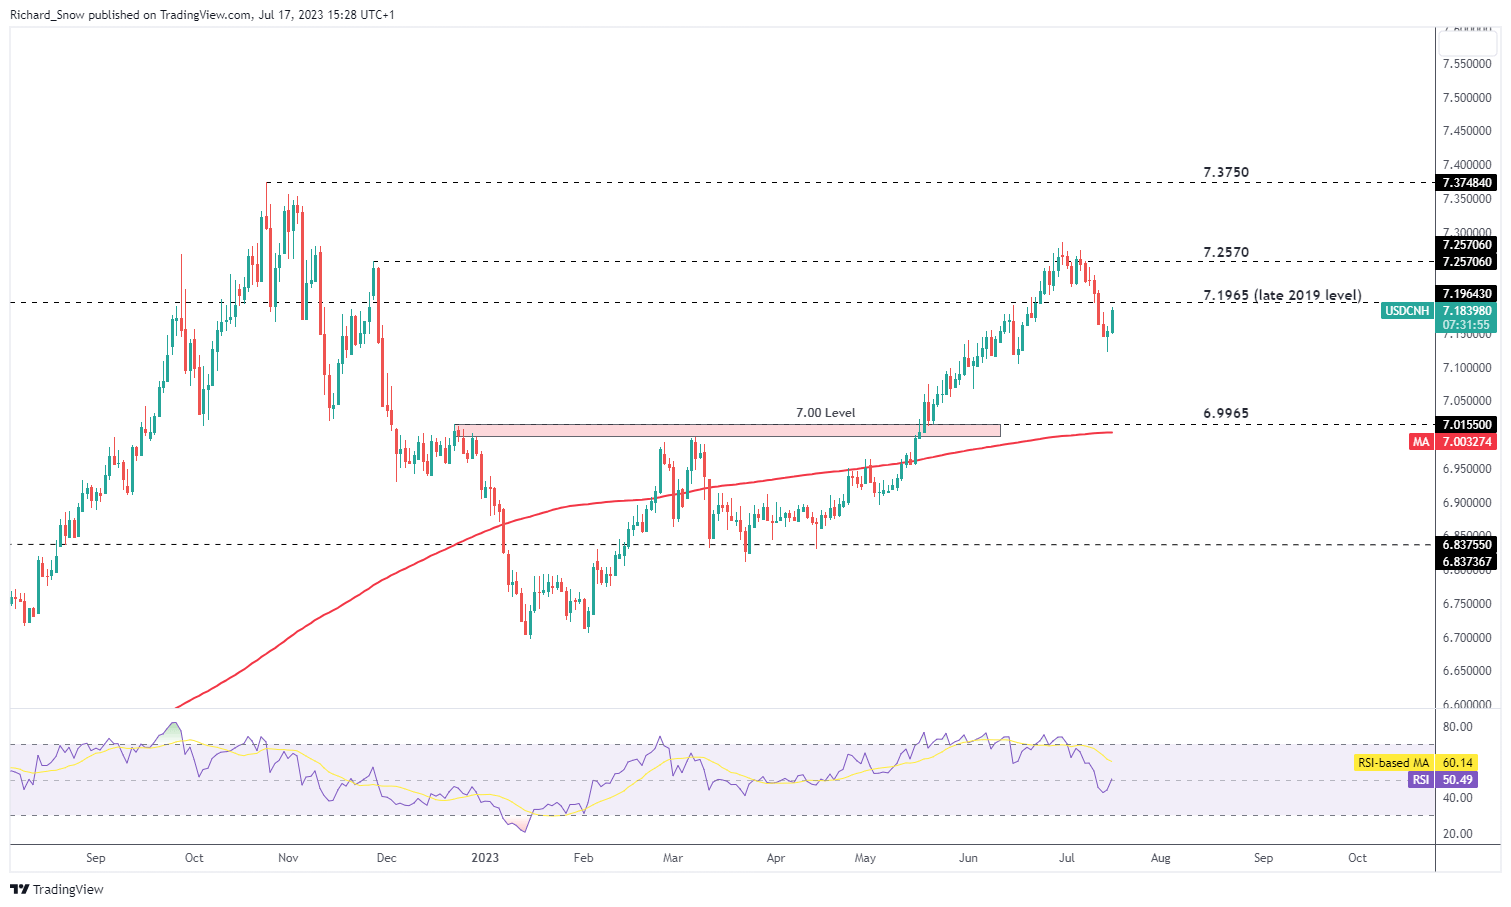
USD/CNH Technical Levels to Look out for
USD/CNH has experienced a healthy retracement, heading lower from the high at the end of June. Markets now price in a lower US terminal rate after core CPI printed well below estimate (4.8% vs 5%). The print is significant because core CPI had proven extremely stubborn, trading between 5.4% and 5.7% for months before may’s print of 5.3% had markets vary that the print might be a one off. It would appear that disinflation is the new base case in the US, seeing the dollar trade sharply lower.
Prices remain above the 200 day moving average with todays price action on track to reveal a morning star formation – typically a bullish formation.
USD/CNH Daily Chart
Source: TradingView, prepared by Richard Snow
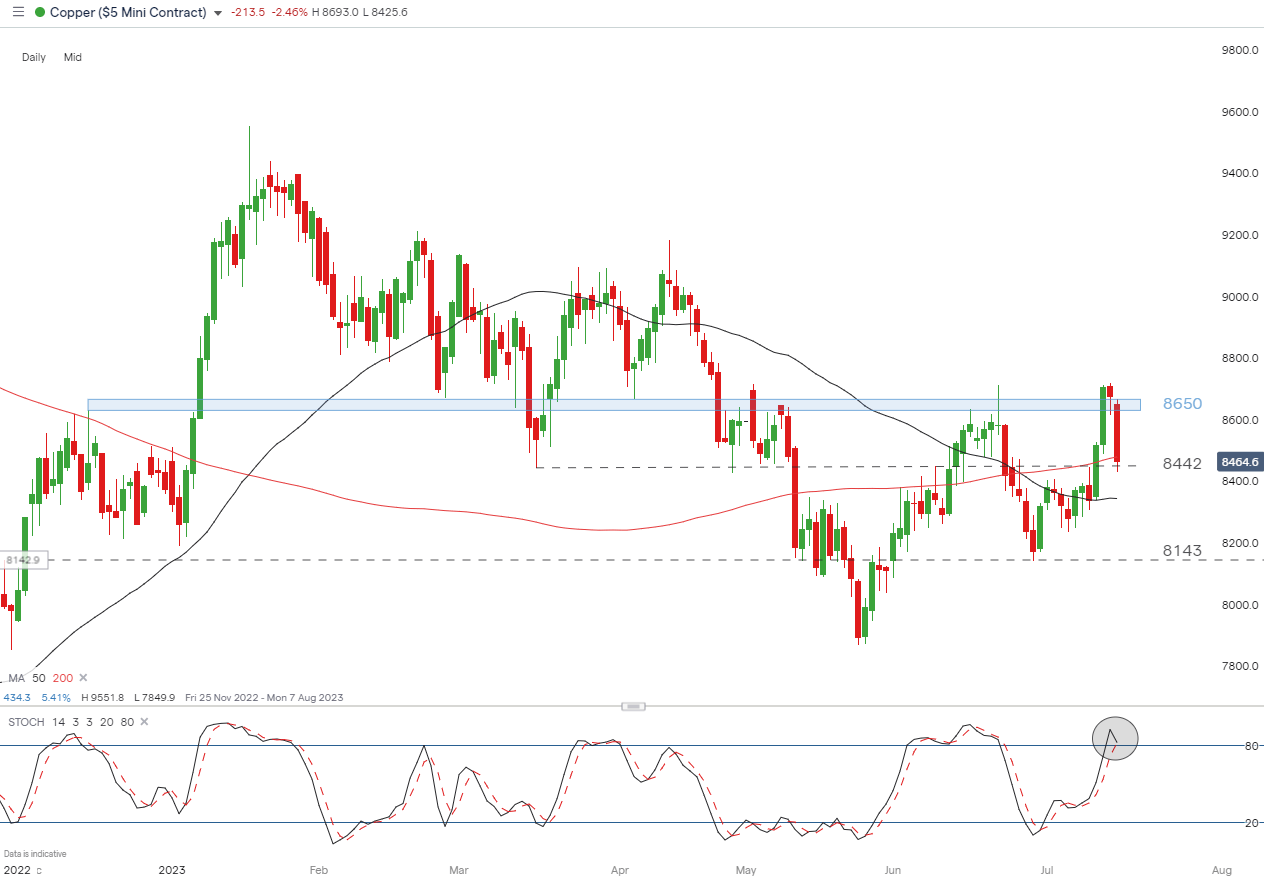
Copper Prices Under Pressure After Chinese Data Fails to Impress
Copper prices appeared to continue the longer-term downtrend on Monday. Trading sharply lower after the disappointing Chinese data. The recent USD selloff brought with it higher metal prices – rising above the 200 simple moving average and even closing above the 8650 zone of resistance briefly.
The stochastic indicator has ventured into overbought territory before turning sharply lower, now testing 8442 – the prior low in March and April. More importantly, the 200 SMA is the most immediate level of support. With fundamental data trending lower in China, the appetite for copper may come under pressure. China consumes over 50% of global copper.
Copper Daily Chart
Source: TradingView, prepared by Richard Snow
DailyFX provides forex news and technical analysis on the trends that influence the global currency markets.


