- The bias is to the downside according to the longer-term charts.
- USD/MXN bears are looking for a break of daily support structure.
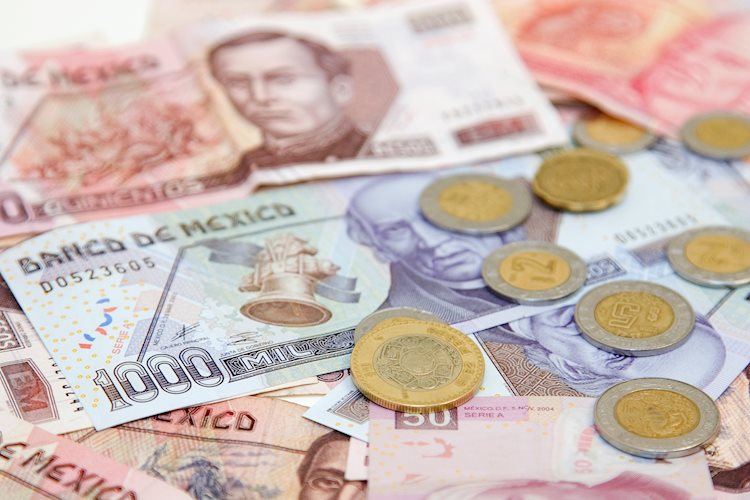
The Mexican peso has been confined to a relatively narrow range from the late June business and all of July so far. This
USD/MXN, would, therefore, be expected to break out of this lull in due course and the following illustrates a bearish bias from a monthly and weekly perspective.
The monthly chart shows that the price broke support at the end of 2020 which opens the risk of a continuation to the downside this year.
Since doing so, the price has corrected all the way to a 61.8% Fibo at the March highs of 21.6353.
The price was subsequently rejected and the correction stalled; This in itself is bearish.
Given the combination of all this, the bias is to the downside on the monthly charts.
Additionally, from the weekly perspective, the bias is also bearish according to the lower weekly close 19.7458 following the lower weekly highs of 20.7138.
There has been a correction to the 38.2% Fibo that has a confluence of the 21-week EMA and resistance area between April and year to date business.
The correction would, therefore, be expected to stall and lead to a downside continuation.
However, from a daily perspective, bears will need to wait for a bearish structure for a high probability set up to the downside.
For now, the market remains bounded by support and resistance with no bias either way:
The above illustrates the potential for the price to break the dynamic trendline support followed by price action forming a bearish structure to the downside and a subsequent break of the horizontal support structure.


-637619682219612414.png)
-637619685419713290.png)
-637619692441608914.png)


