
- USD/TRY looks south towards 8.60 as RSI turns bearish
- Stiff resistance is seen at 8.6976 while 8.6054 could curb the losses.
- All eyes remain on the FOMC minutes for fresh trading impetus.
The recovery in USD/TRY appears to have faltered this Wednesday, as the sellers return amid a broadly subdued US dollar, courtesy of the persistent weakness in the Treasury yields.
The Delta covid strain concerns and renewed jitters over the global economic recovery prompted safe-haven flows into the US bonds, translating into a sell-off in the yields.
Markets also remain cautious ahead of the all-important Fed meeting’s minutes, as it may throw fresh hints on the central bank’s next policy moves.
From a near-term technical perspective, USD/TRY has been ranging in a familiar band, forming lower highs since the June-end highs. The price action has taken the shape of a falling wedge on the four-hour chart.
A four-hourly candlestick closing above the falling trendline resistance at 8.6976 will validate the wedge breakout, opening doors towards the record highs of 8.8022.
The wedge upside hurdle also coincides with the bearish 50-Simple Moving Average (SMA) on the said time frame.
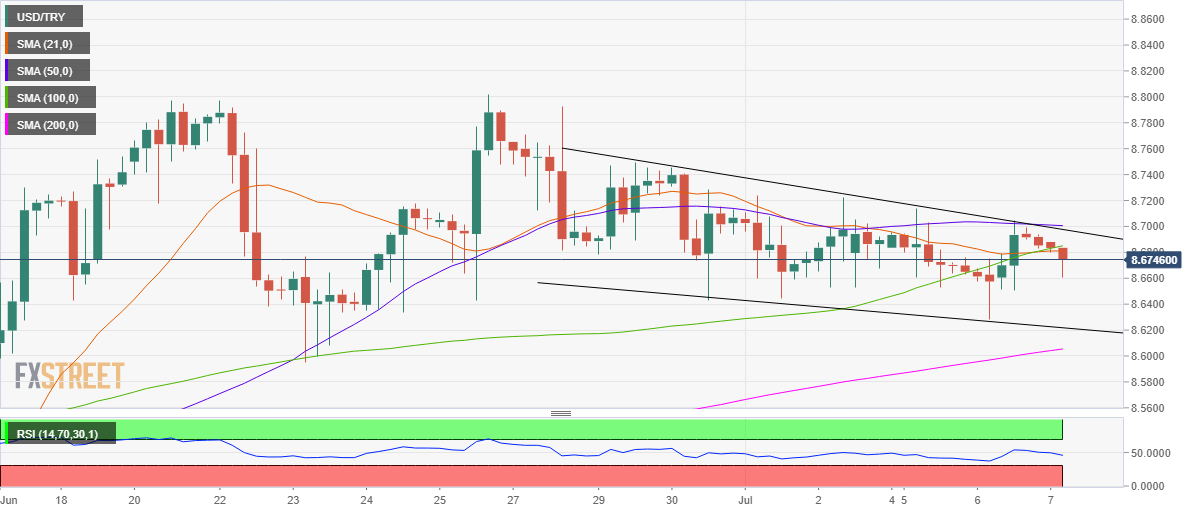
However, the 14-day Relative Strength Index (RSI) has flipped bearish, cutting the midline from above, which suggests that the bears are likely to retain control in the coming hours.
Therefore, the downside remains exposed towards the wedge support at 8.6217, a break below which would invalidate the wedge pattern.
Buyers would then scramble for support at 8.6054, where the 200-SMA appears.


