- XLM price triggers a bullish daily hammer candlestick pattern with a trade above $0.401.
- 12-hour Relative Strength Index (RSI) prints an oversold reading similar to the February low.
- Ascending channel’s lower trend line shifts from support to resistance.
XLM price could not escape yesterday’s selling pressure and collapsed below the May 19 crash low before rebounding back above the strategically important 200-day simple moving average (SMA). Based on prices from Coinbase, it was the largest weekly decline since August 2014 at -48.90%. The channel’s lower trend line and the 200-day SMA likely to keep Stellar range bound for the foreseeable future.
The 65% decline for XLM price at yesterday’s low should not have come as a surprise for Stellar investors and readers of FXStreet. The digital token was entangled in a precarious situation highlighted by two daily shooting star patterns at the channel’s upper trend line and a bearish momentum divergence on the daily and weekly RSI at the April and May highs.
On May 19, XLM price sliced through the 50-day SMA, the channel’s lower trend line and the 200-day SMA, removing the weakest of holders and biggest pockets of anxiety. The result was a 50% rebound and a close above the channel’s lower trend line.
The moment of relief proved short-lived as XLM price plummeted below the May 19 low yesterday, evacuating the investors that bought the dip and effectively preparing Stellar to begin defining an actionable bottom.
Today, XLM price has tagged the channel’s vital lower trend line but has since reversed. A daily close above the trend line would alter the near-term outlook for Stellar, but not enough to position the token as a future leader for the next rally higher in the cryptocurrency complex.
Continued strength for XLM price will be confronted by the 50-day SMA at $0.551. Any further upside would need to be evaluated if Stellar does reach the tactically important moving average.
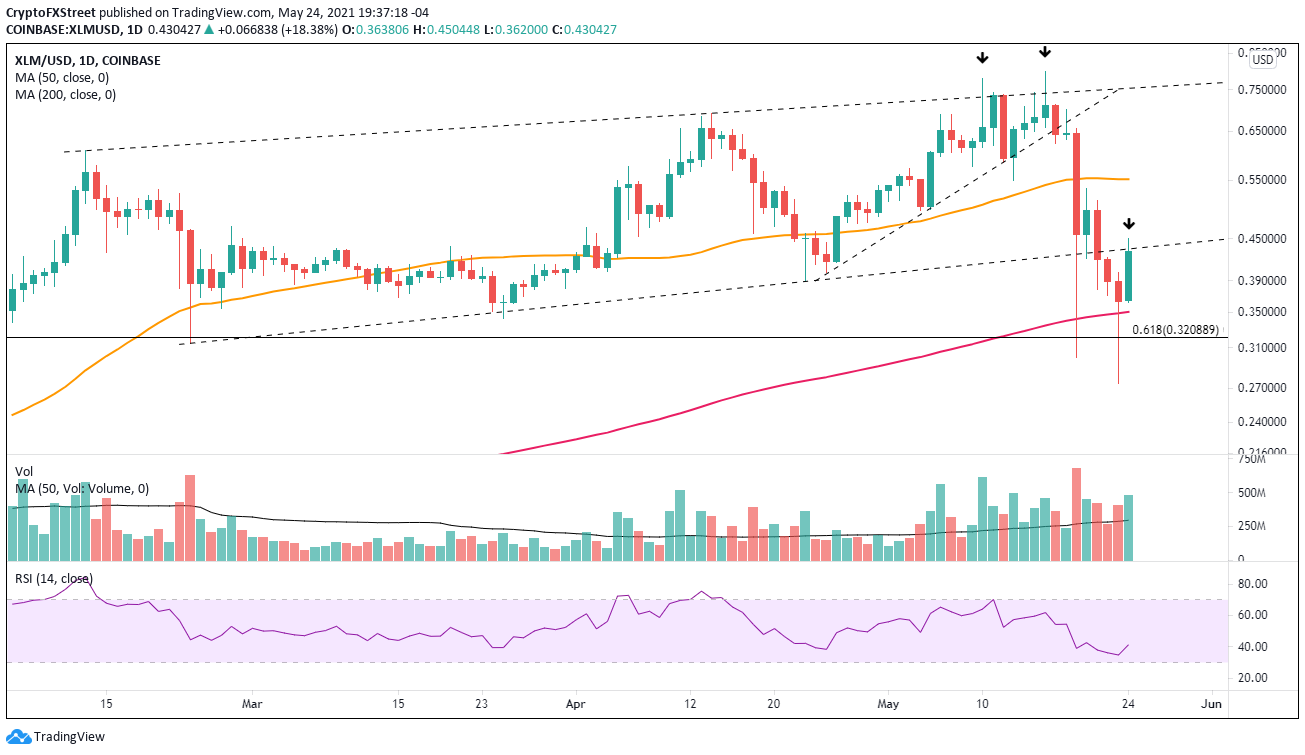
XLM/USD daily chart
On the downside, XLM price is supported by the 200-day SMA at $0.350 and then the 61.8% Fibonacci extension of the rally beginning March 2020 at $0.320. Another meltdown in cryptocurrencies may drive Stellar down to yesterday’s low at $0.274.