/definition-of-etf-21007500_Large.jpg)
Share:
Ripple price has filled a symmetrical triangle on the weekly timeframe with prospects for more gains amid rising RSI.
XRP price could rise 10% to tag the $0.7000 psychological level as altcoins poise for spot BTC ETF-related potential rally.
The bullish thesis will be invalidated upon a break and close below $0.5773, which coincides with the Bollinger indicator’s centerline.
Ripple (XRP) price action has consolidated into a symmetric triangle, with prospects for a bullish breakout as the market sentiment remains optimistic.
Also Read: XRP price is coming up on an important directional breakout as Ripple fills multi-year triangle
XRP has joined the altcoin community in the green, poised for a rally as markets anticipate possible spot Bitcoin exchange-traded funds (ETFs) approval.
With most altcoins flashing green on the daily timeframe, the optimism comes as the spot BTC ETFs approval window opens, beginning January 2 to 3. Afterward, the hard deadline of January 5 to 10 will open, forecasted by analysts from Bloomberg Intelligence, James Seyffart, and Eric Balchunas, with 90% approval odds.
With XRP standing among the altcoins poised to benefit from the expected approvals, trading volume for the remittance token is up 65%.
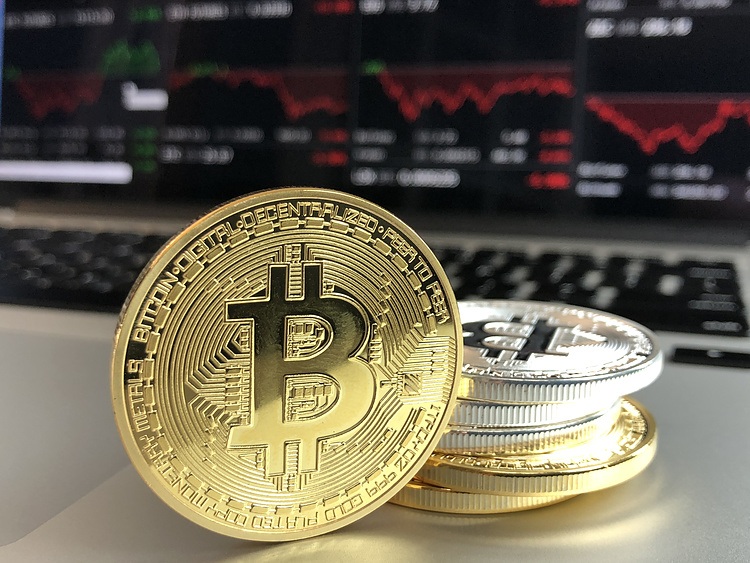
What is an ETF?
An Exchange-Traded Fund (ETF) is an investment vehicle or an index that tracks the price of an underlying asset. ETFs can not only track a single asset, but a group of assets and sectors. For example, a Bitcoin ETF tracks Bitcoin’s price. ETF is a tool used by investors to gain exposure to a certain asset.
Is Bitcoin futures ETF approved?
Yes. The first Bitcoin futures ETF in the US was approved by the US Securities & Exchange Commission in October 2021. A total of seven Bitcoin futures ETFs have been approved, with more than 20 still waiting for the regulator’s permission. The SEC says that the cryptocurrency industry is new and subject to manipulation, which is why it has been delaying crypto-related futures ETFs for the last few years.
Is Bitcoin spot ETF approved?
Bitcoin spot ETF has been approved outside the US, but the SEC is yet to approve one in the country. After BlackRock filed for a Bitcoin spot ETF on June 15, the interest surrounding crypto ETFs has been renewed. Grayscale – whose application for a Bitcoin spot ETF was initially rejected by the SEC – got a victory in court, forcing the US regulator to review its proposal again. The SEC’s loss in this lawsuit has fueled hopes that a Bitcoin spot ETF might be approved by the end of the year.
Ripple (XRP) price consolidation between the $0.5773 and $0.6644 range has culminated in XRP price filling a symmetric triangle on the weekly timeframe. XRP trades above the centerline (20-period Simple Moving Average) of a Bollinger Bands indicator at $0.5719. This is a good sign for the bulls, especially because volatility is optimal, evidenced by the standard widening of the upper and lower bands at $0.6970 and $0.4470 levels, respectively.
Notably, when the bands tighten during a period of low volatility, the chances of a sharp price move in either direction increase. Also, volatility increases when the bands separate by an unusually large amount, and any existing trend may be ending.
Based on the outlook of the Relative Strength Index (RSI), momentum is rising, which accentuates the bullish outlook and is supported by the position of the Moving Average Convergence Divergence (MACD) and Awesome Oscillator (AO) indicators in the positive territory.
Increased buying pressure above current levels could see XRP price break above the upper boundary of the triangle by flipping the $0.6644 resistance to a support floor.
Further north, the gains could extend for Ripple price to overcome resistance due to the upper band of the Bollinger indicator at $0.6968 before hitting the forecasted $0.7000 target.
In a highly bullish case, the gains could extrapolate for Ripple price to tag the $0.7515 resistance, or in the very ambitious case, test $0.8516, level last seen in July 2023.
XRP/USDT 1-week chart
The bullish thesis abounds on the daily timeframe as well, with XRP price enjoying robust support from the lower boundary of the wedge as well as the 200-day Moving Average (MA). Owing to the fact that the MA cross between the 100-day SMA and the 200-day MA at $0.6266 and $0.6225 levels, respectively, have effectively halted multiple bearish attempts, underscoring the presence of substantial demand in the XRP market.
Also, the golden cross seen between the 100-day and 200-day MAs on December 29 suggested a bullish outlook for XRP’s long-term prospects. Now, with the price approaching the narrowing end of the technical formation, enhanced buyer momentum could see XRP price breakout above the, initiating a sustained bullish trend.
XRP/USDT 1-day chart
On the flip side, if the bears have their way, XRP price could drop below the $0.5773 support on the weekly timeframe, not only losing the support offered by the ascending trendline of the symmetric triangle but also invalidating the prevailing bullish thesis.
The breakdown would pave the way for a continuation of the move south, with Ripple price likely to test the $0.4615 support floor. In the dire case, XRP price could tag the lower band of the Bollinger indicator at $0.4471.
In the same way, traders should be aware that the ascending wedge pattern is a bearish pattern, signaling a trend reversal incoming. An unexpected breach below the lower boundary of the wedge could initiate a cascading effect, which could lead to a long-squeeze.
Share:
Cryptos feed
Information on these pages contains forward-looking statements that involve risks and uncertainties. Markets and instruments profiled on this page are for informational purposes only and should not in any way come across as a recommendation to buy or sell in these assets. You should do your own thorough research before making any investment decisions. FXStreet does not in any way guarantee that this information is free from mistakes, errors, or material misstatements. It also does not guarantee that this information is of a timely nature. Investing in Open Markets involves a great deal of risk, including the loss of all or a portion of your investment, as well as emotional distress. All risks, losses and costs associated with investing, including total loss of principal, are your responsibility. The views and opinions expressed in this article are those of the authors and do not necessarily reflect the official policy or position of FXStreet nor its advertisers. The author will not be held responsible for information that is found at the end of links posted on this page.
If not otherwise explicitly mentioned in the body of the article, at the time of writing, the author has no position in any stock mentioned in this article and no business relationship with any company mentioned. The author has not received compensation for writing this article, other than from FXStreet.
FXStreet and the author do not provide personalized recommendations. The author makes no representations as to the accuracy, completeness, or suitability of this information. FXStreet and the author will not be liable for any errors, omissions or any losses, injuries or damages arising from this information and its display or use. Errors and omissions excepted.
The author and FXStreet are not registered investment advisors and nothing in this article is intended to be investment advice.