
- Zilliqa price fractures the May 23 low after the largest daily decline since May 19.
- Daily Relative Strength Index (RSI) fails to confirm an oversold condition, hinting at more weakness.
- Yesterday’s low was near the rising wedge measured move of over 50%.
Zilliqa price followed the cryptocurrency complex lower this week, printing a new correction low early Tuesday. However, the rebound and follow-through day have been muted, hinting at residual selling pressure or a simple pause in the corrective process. Until ZIL recovers $0.085 on a daily closing basis, market speculators should remain on the sidelines.
At yesterday’s low, Zilliqa price had fallen over 75% from the May high and a staggering 60% from the rebound high of $0.157 printed on June 3, placing ZIL among the worst-performing cryptocurrencies.
From May 23 to June 4, Zilliqa price illustrated a rising wedge pattern that finally broke to the downside on June 5. The wedge’s measured move is 56%, putting the target at $0.052. However, based on the work of Bulkowski, the measured move is 44.50% or a target of $0.067. The low yesterday was $0.059, fulfilling one of the targets but leaving a little more downside for ZIL if selling reemerged.
Zilliqa price needs to close above the 23.60% Fibonacci retracement of the advance beginning in March 2020 at $0.085 before considering a new long position in ZIL. Beyond the retracement level, the digital token could engineer a rally to the 2020 rising trend line at $0.117 or even the 200-day simple moving average (SMA) at $0.124, yielding a 45% return for the disciplined market operators.
Any further upside will be confronted by the declining 50-day SMA, logging a death cross signal within the next five days.
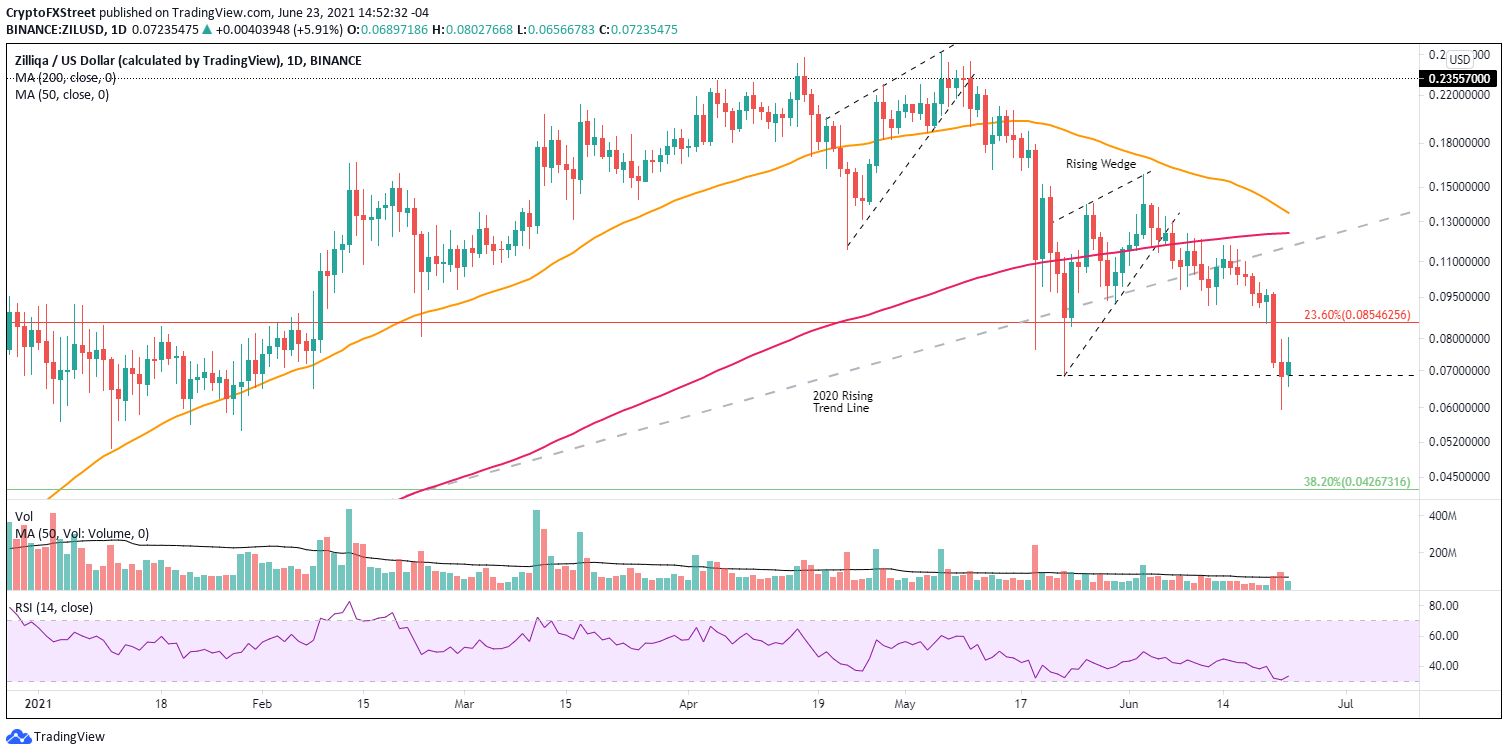
ZIL/USD daily chart
The recovery of Zilliqa price over the last two days has been sluggish, lacking the type of impulsiveness necessary to confirm a low and place ZIL in a position to overcome the resistance defined by the 23.6% retracement.
The price action speaks of indecision and raises the odds of residual selling pressure surfacing in the short term, possibly driving Zilliqa price to the original measured move target of $0.52. If the selling is accompanied by a broader sell-off in the cryptocurrency market, ZIL could test the 38.2% retracement at $0.042.
Based on the Santiment Social Volume metric, ZIL social media volume has been subdued compared to many other digital assets. In fact, the 7 four-hour moving average is at the lowest level since mid-December 2020, signifying that ZIL has fallen off the radar of over 1000 social media channels.
Weak social media volume does accompany lower prices. Still, social media metrics for other cryptocurrencies have begun to bottom despite the continuance of the correction. If there is a lack of interest in ZIL, the more difficult for Zilliqa price to stage a meaningful recovery.
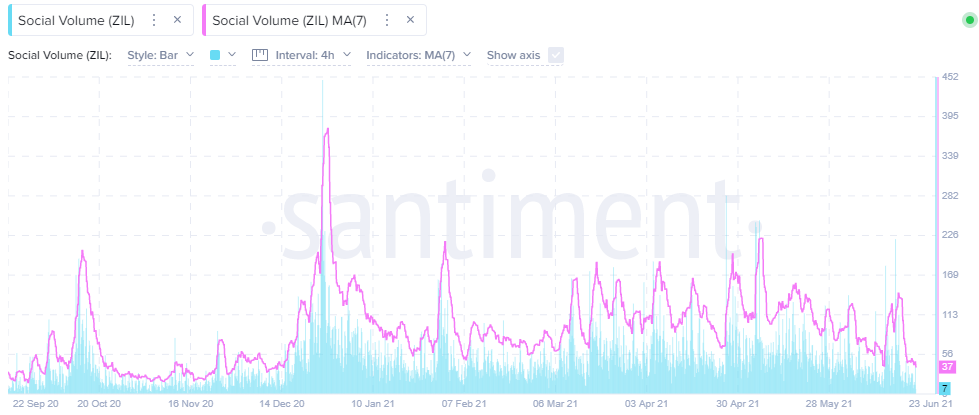
ZIL Social Volume – Santiment
Within the context of indecision, ZIL investors should resist the urge to buy against the May 23 low in favor of patience. Moreover, it may take a catalyst to reconcile the indecision that has accompanied the new correction low as strategic support and resistance levels loom large, potentially suffocating Zilliqa price moving forward.