

GBP/USD Prices, Charts, and Analysis
IMF turning positive on UK growth.UK PMIs paint a further manufacturing-services divergence.US debt discussions continue as the clock counts down.
The International Monetary Fund (IMF) has performed a quick U-turn on the UK’s growth outlook and now sees the economy expanding by 0.4% in 2023. In January this year, the IMF predicted that the UK economy would contract by 0.6% in 2023, while just last month they predicted that the UK would contract by 0.3%. The IMF’s newfound confidence is based on falling energy costs, improved business confidence, and robust domestic demand.
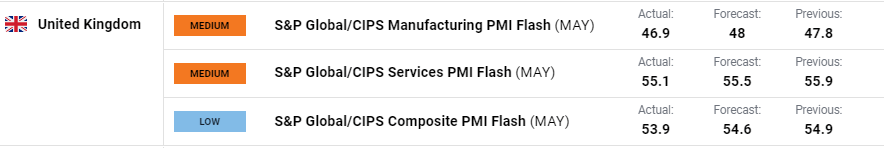
The latest S&P PMIs paint a mixed picture of the UK economy with the manufacturing sector posting another decline in output while the services sector remained buoyant, albeit at a marginally lower level than last month. According to Chris Williamson, chief business economist at data provider S&P Global Market Intelligence, ‘The surveys are consistent with GDP rising 0.4% in the second quarter after a 0.1% rise in the first quarter.’
S&P Global/CIPS Flash United Kingdom PMI
US debt ceiling discussions continue with little to no sign of a compromise seen as yet. While both sides are keen to avoid a breakdown in negotiations, US Treasury Secretary Janet Yellen warned yesterday that it is ‘highly likely’ that the debt ceiling will be pierced in early June, upgrading her warning from ‘likely’ a couple of weeks ago.
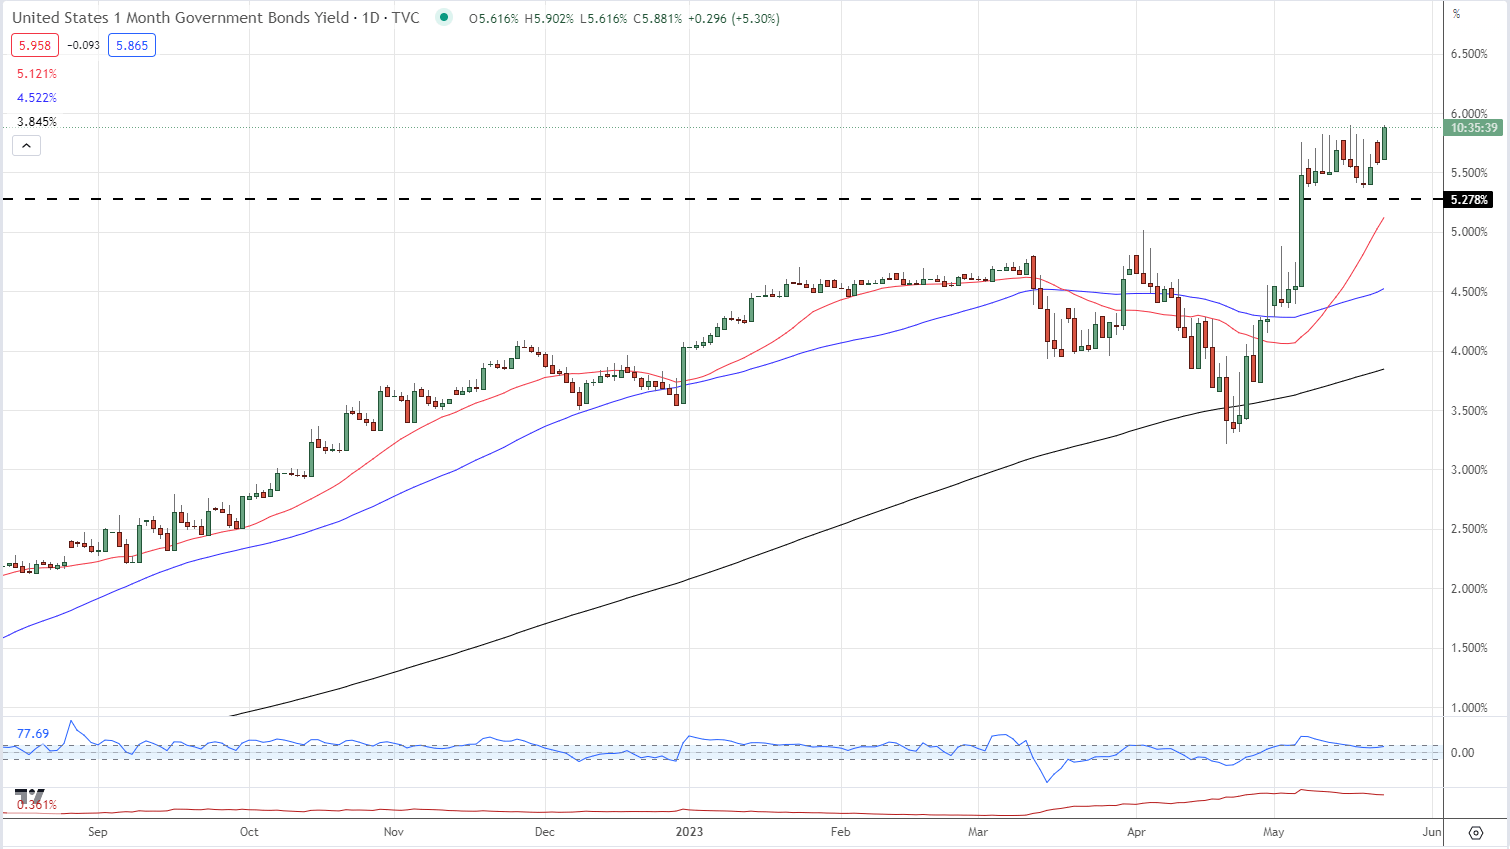
Short-dated US Bill yields continue to push higher as investors demand more for their money over the potential default period. The one-month US Treasury Bill yield closed yesterday at 5.88%, a fraction away from a fresh multi-decade high.
Debt Ceiling Blues, Part 79. What Happens if the US Defaults?
US Treasury One-Month Bill Yield
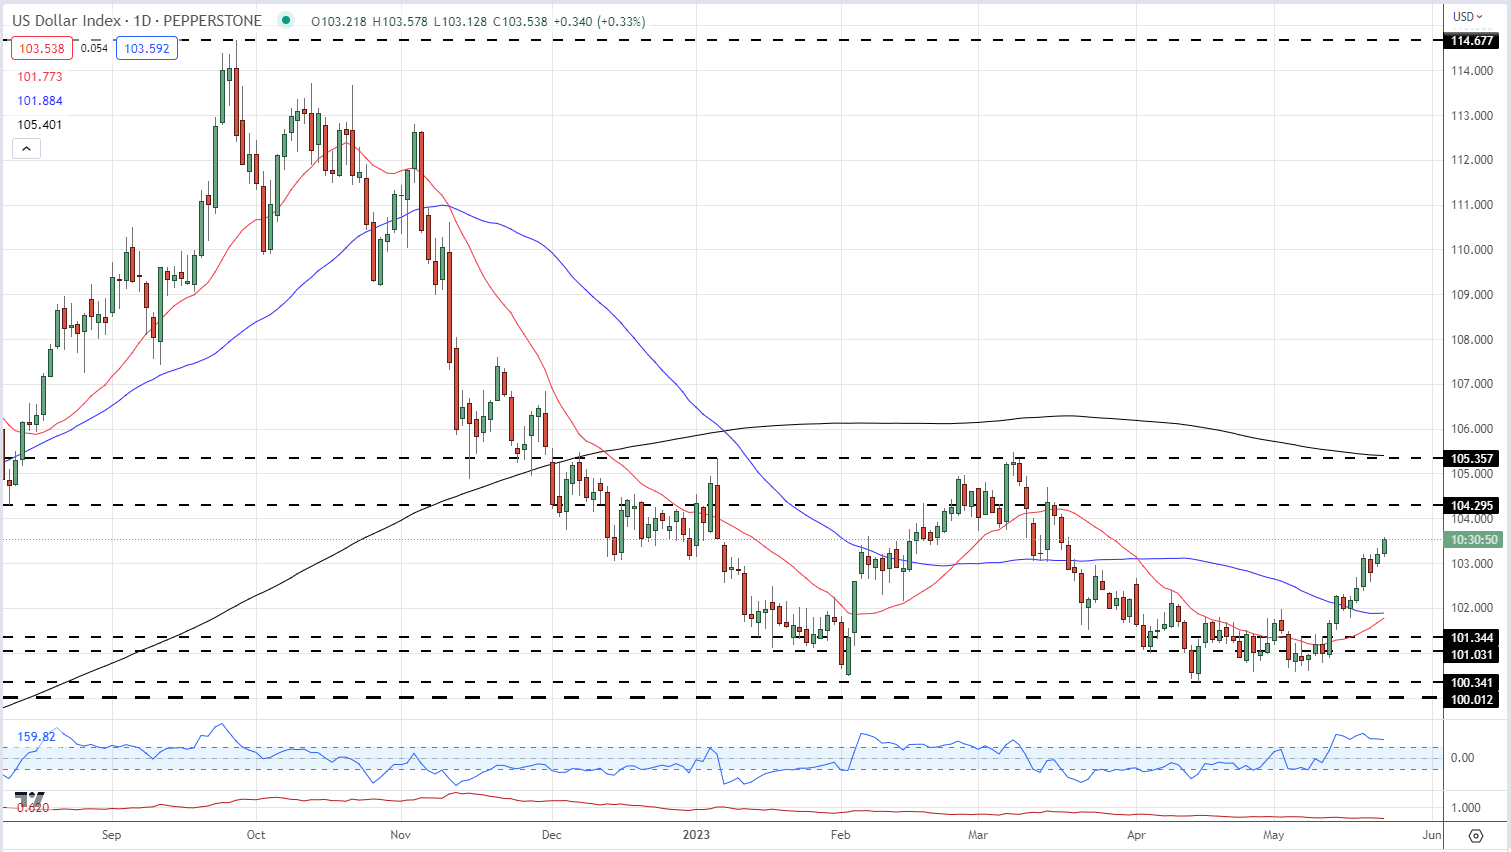
Cable remains heavily influenced by the US dollar and continues to weaken. The US dollar is trading at a new two-month high, with the daily chart highlighting a series of higher lows and higher highs since the start of the month.
US Dollar Index Daily Chart – May 23, 2023
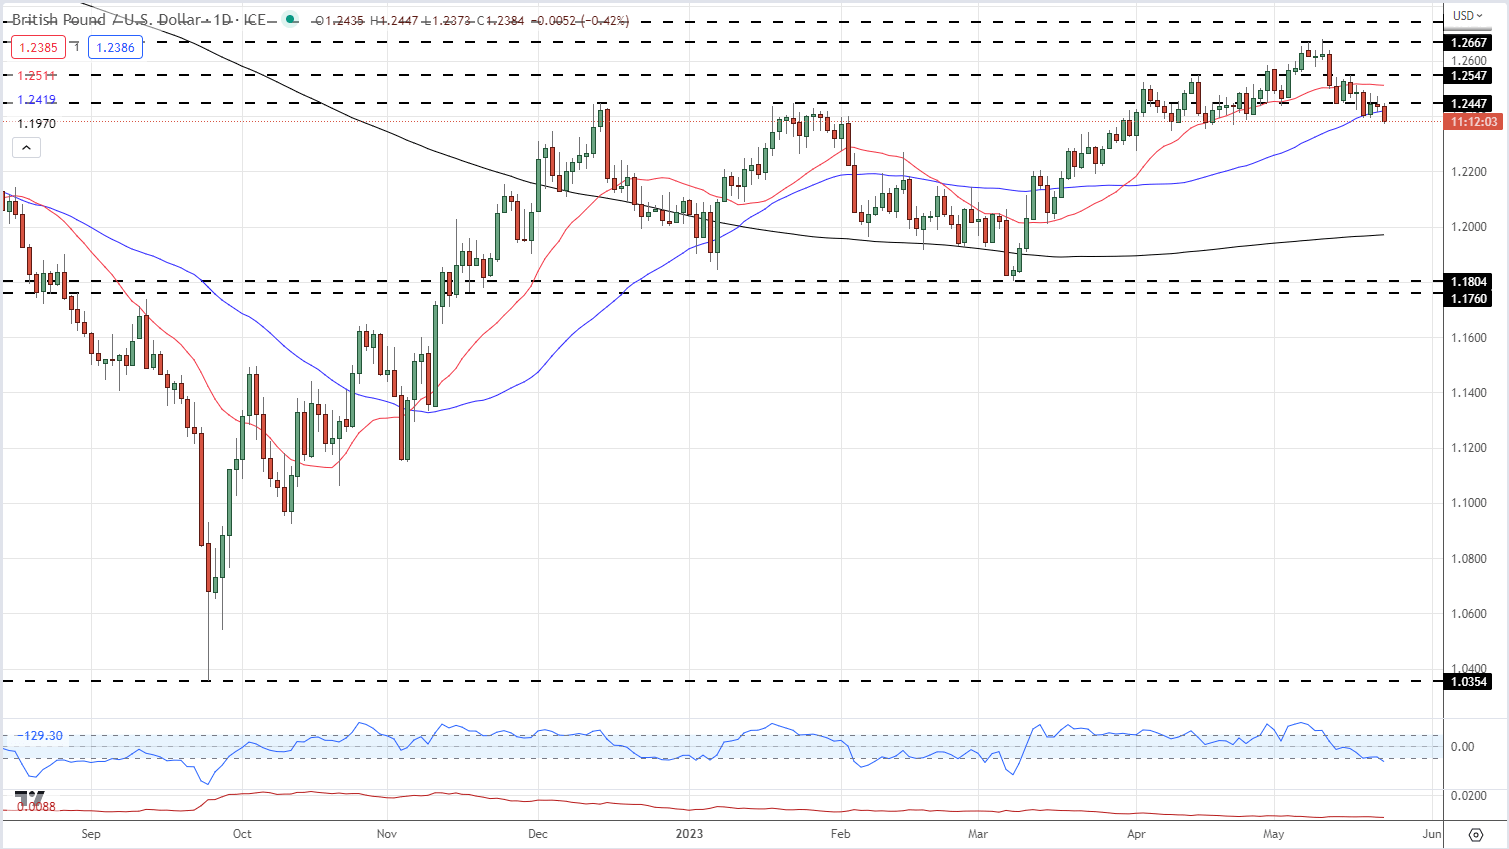
GBP/USD is now trading at a fresh one-month low after breaching a recent double bottom around 1.2395. The pair is below both the 20- and 5-day moving averages and eye 1.2345 ahead of 1.2300.
GBP/USD Daily Price Chart – May 23, 2023
Chart via TradingView
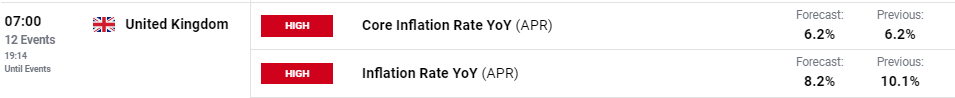
Tomorrow sees the latest UK inflation report released at 07:00 UK. Headline inflation is expected to fall sharply, while core inflation is forecast unchanged.
For all market-moving events and data releases see the real-time DailyFX Calendar
Retail Traders Increase Their Net-Long Positions
Retail trader data shows 52.45% of traders are net-long with the ratio of traders long to short at 1.10 to 1.The number of traders net-long is 2.63% higher than yesterday and 12.71% higher from last week, while the number of traders net-short is 0.31% higher than yesterday and 18.07% lower from last week.
We typically take a contrarian view to crowd sentiment, and the fact traders are net-long suggests GBP/USD prices may continue to fall. Traders are further net-long than yesterday and last week, and the combination of current sentiment and recent changes gives us a stronger GBP/USD-bearish contrarian trading bias
What is your view on the GBP/USD – bullish or bearish?? You can let us know via the form at the end of this piece or you can contact the author via Twitter @nickcawley1.


