

U.S. STOCK MARKET ANALYSIS & OUTLOOK
Yields hurt growth stocks bringing down U.S. stock prices.Focus will be solely on U.S. CPI next week.Bull flags apparent on both daily SPX and NDX charts.
SPX, NASDAQ 100 FUNDAMENTAL BACKDROP
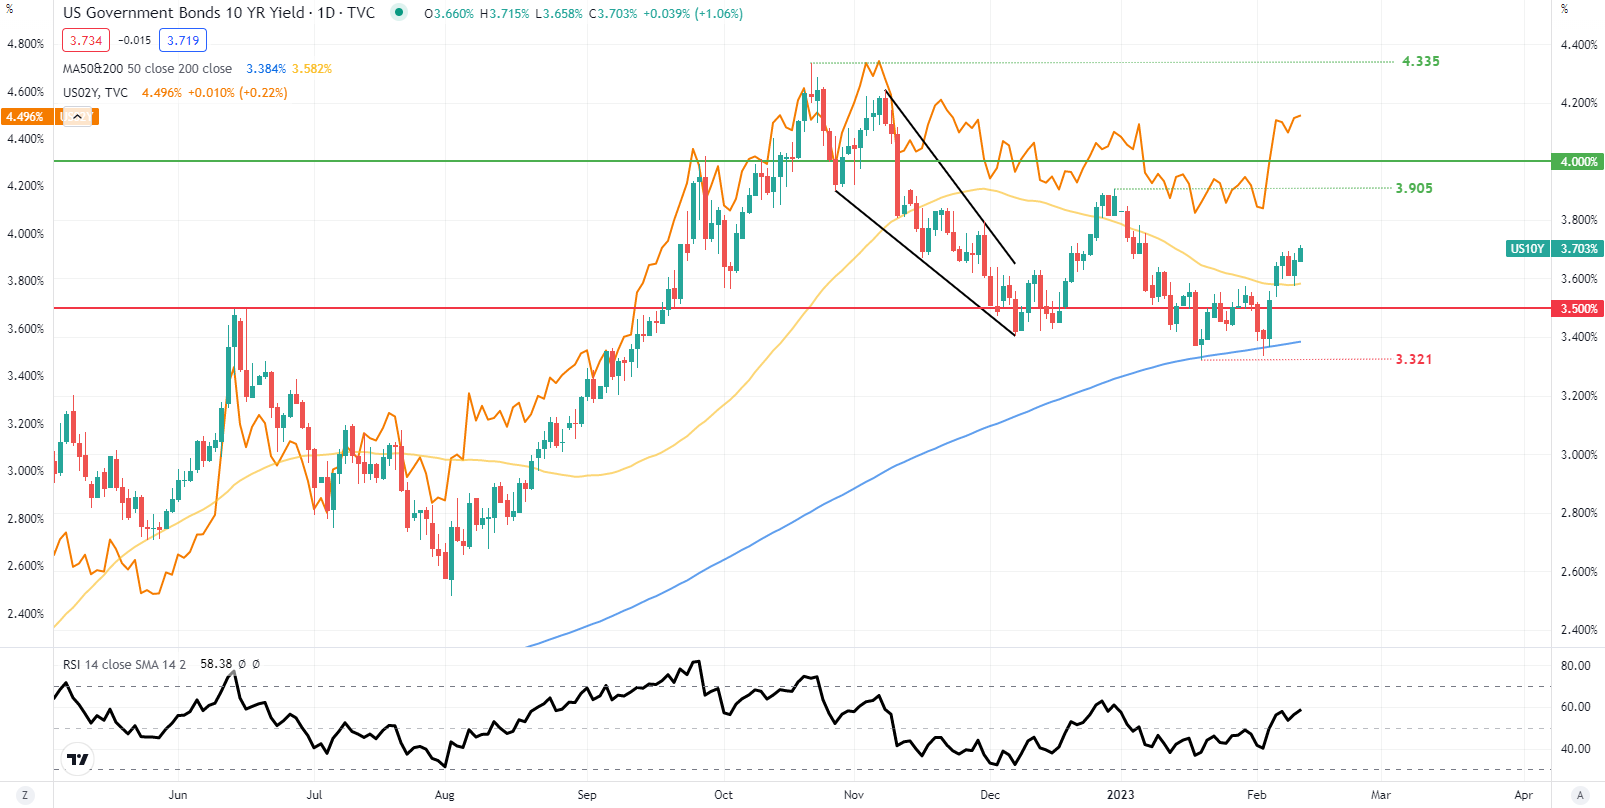
U.S. stocks have been under pressure going into next week’s key economic data releases after the carry over effects of the recent Non-Farm Payroll (NFP) report hurt valuations (in particular rate-sensitive growth stocks). The chart below shows both the 2-year (orange) and 10-year U.S. government bond yields rising of recent leaving future earnings for these stocks less attractive for investors.
U.S. 10-YEAR & 2-YEAR GOVERNMENT BOND YIELDS
Chart prepared by Warren Venketas, TradingView
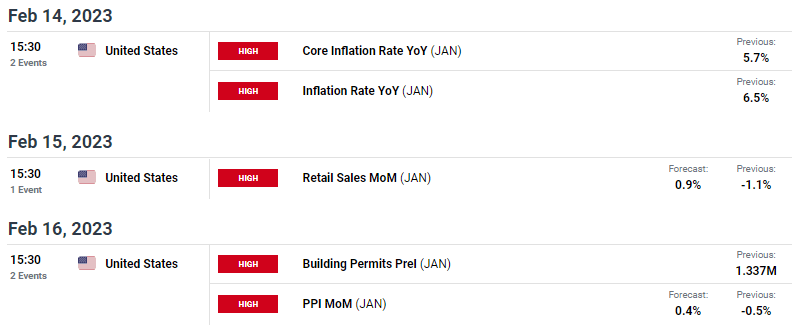
Reverting back to the economic calendar for the upcoming week, the CPI report (see economic calendar below) will be critical to see if the Fed‘s aggressive monetary policy will continue to filter through to lesser inflationary pressures. That being said, the inflation rate remains far off the Fed’s 2% target rate and the rate of decline is not as speedy as many expected. Anything remotely ‘sticky’ or above estimates will likely result in further downside for U.S. stocks with greater losses showing up on the NASDAQ 100 index – as has been the case of recent over the S&P 500 index.
Post-CPI, retail sales and PPI statistics will come into focus with both releases projected to improve on their previous prints, once again leading to a hawkish Fed and thus detrimental to stocks (should actual data come in above or equal to forecasts).
U.S. ECONOMIC CALENDAR
Source: DailyFX Economic Calendar
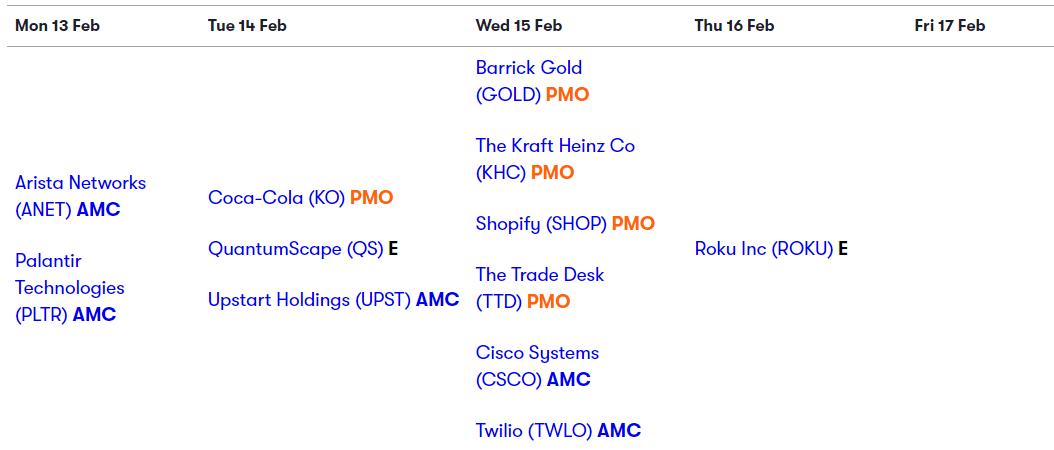
As earnings season looks to wind down, there are still several albeit less significant releases scheduled for next week (see table below).
U.S. EARNINGNS CALENDAR (FEBRUARY 13-17)
Source: Interactive Investor
TECHNICAL ANALYSIS
SPX DAILY CHART
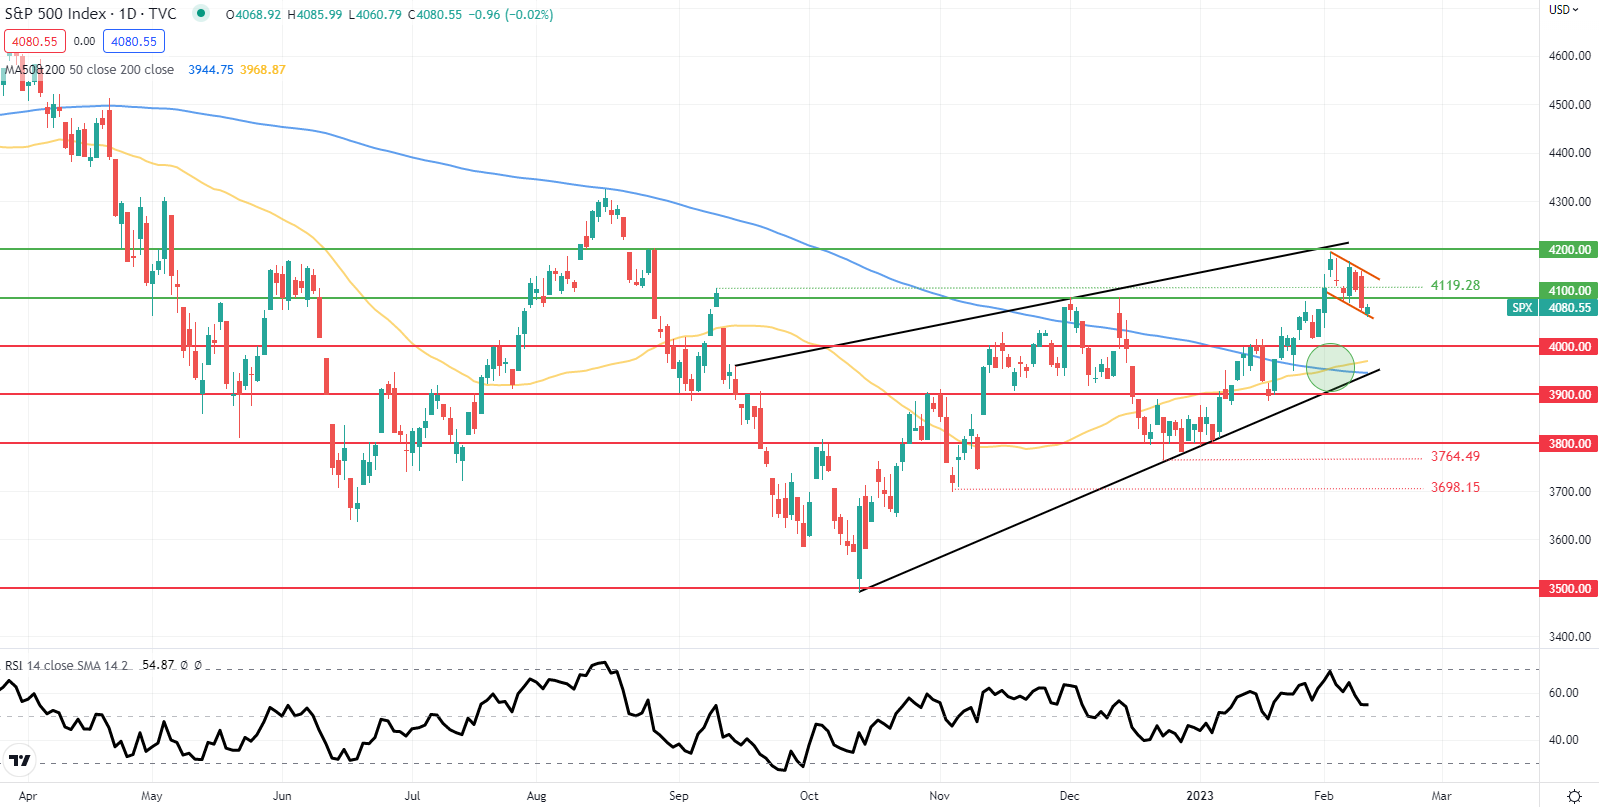
Chart prepared by Warren Venketas, TradingView
The daily chart of the S&P 500 index looks to be exhibiting two different indicators both short and long-term. The long-term rising wedge pattern (black) suggests impending downside should wedge support break but in the short-term, a golden cross (green) via the 50-day MA and 200-day MA and a bull flag (orange) could point to near-term upside. These patterns will likely be found out once the inflation data is revealed but does skew the market bias (according to technical analysis) towards bulls.
Resistance levels:
4200.00Flag resistance4119.284100.00
Support levels:
4000.0050-day SMA200-day SMAWedge support
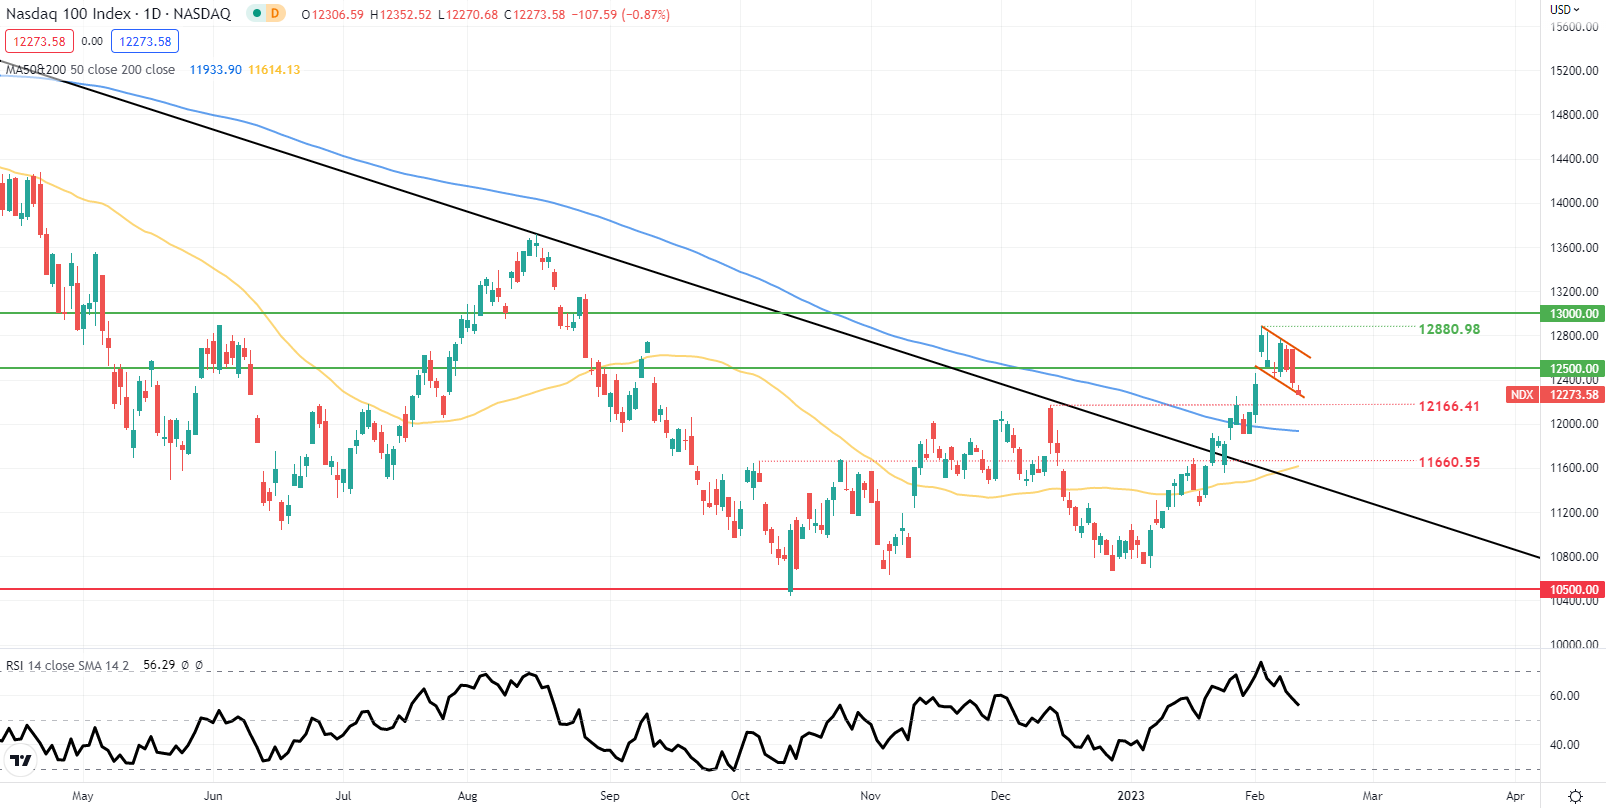
NDX DAILY CHART
Chart prepared by Warren Venketas, TradingView
The NASDAQ 100 is somewhat similar with a bull flag formation (orange) present on the daily chart but may be invalidated should inflation show signs of easing next week.
Resistance levels:
Flag resistance12500.00
Support levels:
12166.41200-day SMAWedge support
IG Client Sentiment Data (IGCS) shows retail traders are currently SHORT on S&P 500, with 54% of traders currently holding short positions (as of this writing). At DailyFX we typically take a contrarian view to crowd sentiment; however, due to recent changes in long and short positioning we arrive at a short-term downside bias.
Contact and followWarrenon Twitter:@WVenketas


